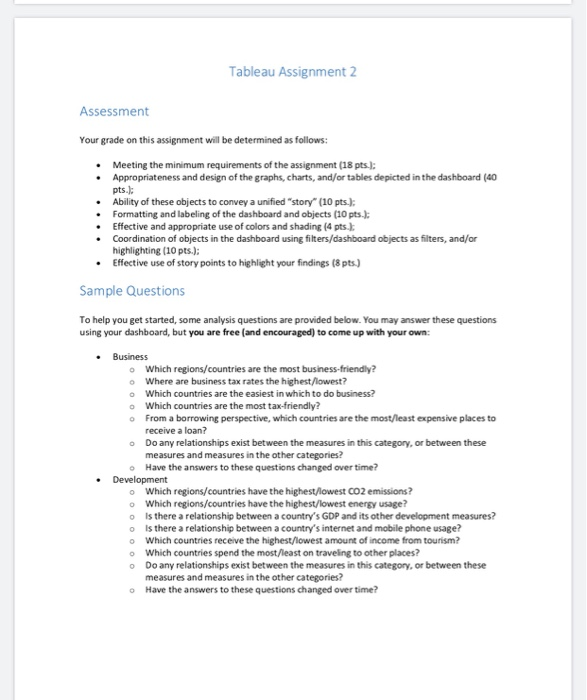
Tableau Assignment 2 Assessment Your grade on this assignment will be determined as follows: .Meeting the minimum requirements of the assignment (18 pts Appropriateness and design of the graphs, charts, and/or tables depicted in the dashboard (40 pts.J .Ability of these objects to convey a unified "story (10 pts.) Formatting and labeling of the dashboard and objects (10 pts.) .Effective and appropriate use of colors and shading (4 pts.) .Coordination of objects in the dashboard using filters/dashboard objects as filters, and/or highlighting (10 pts) . Effective use of story points to highlight your findings (8 pts) Sample Questions To help you get started, some analysis questions are provided below. You may answer these questions using your dashboard, but you are free (and encouraged) to come up with your own Business o Which regions/countries are the most business-friendly o Where are business tax rates the highest/lowest? o Which countries are the easiest in which to do business? o Which countries are the most tax-friendly? o From a borrowing perspective, which countries are the most/least expensive places to receive a loan? Do any relationships exist between the measures in this category, or between these o measures and measures in the other categories? Have the answers to these questions changed over time? o o Which regions/countries have the highest/lowest cO2 emissions? o Which regions/countries have the highest/lowest energy usage? o Is there a relationship between a country's GDP and its other development measures? o Is there a relationship between a country's internet and mobile phone usage? o Which countries receive the highest/lowest amount of income from tourismi? o Which countries spend the most/least on traveling to other places? o Do any relationships exist between the measures in this category, or between these measures and measures in the other categories? Have the answers to these questions changed over time? o On January1, 2016, Bell Company had 100,000 shares of common stock outstanding and 30,000 shares of 7%, $50 par, cumulative preferred stock outstanding. On March 1 Bell purchased 24,000 shares of common stock as treasury stock for $40 per share. It sold 6,000 treasury shares on October 1, at $45 per share. Net income for 2016 was $1,085,430. Required: howing your computations, present in good order Bell's earnings per share for 2016