

Answered step by step
Verified Expert Solution
Question
1 Approved Answer
Tableau Dashboard Activity 7 - 1 : Accounts Receivable Ratios The following Tableau Dashboard shows two different types of visualizations for each of three different
Tableau Dashboard Activity : Accounts Receivable Ratios
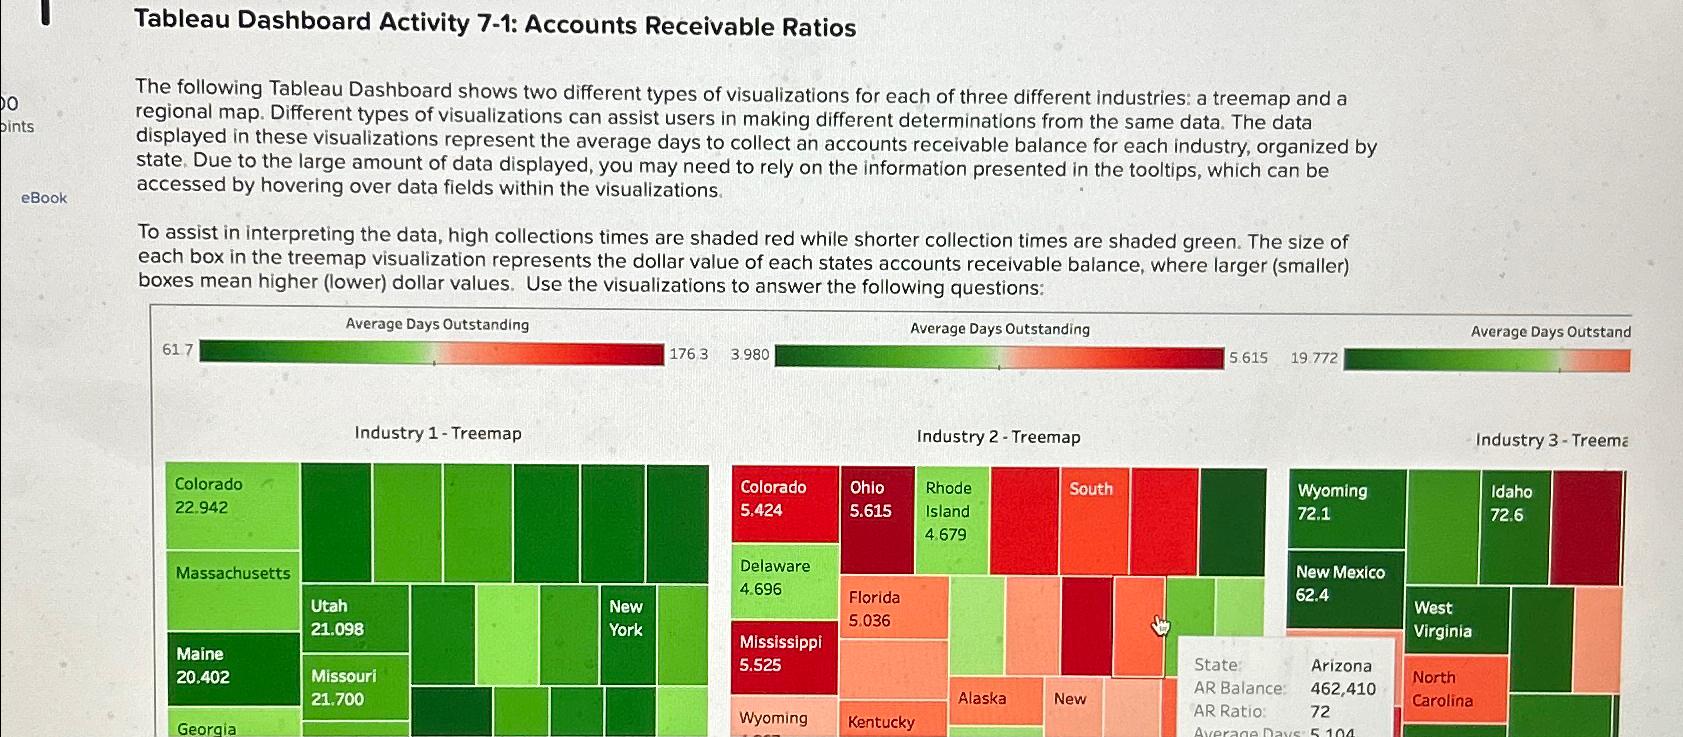
The following Tableau Dashboard shows two different types of visualizations for each of three different industries: a treemap and a regional map. Different types of visualizations can assist users in making different determinations from the same data. The data displayed in these visualizations represent the average days to collect an accounts receivable balance for each industry, organized by state, Due to the large amount of data displayed, you may need to rely on the information presented in the tooltips, which can be accessed by hovering over data fields within the visualizations.
To assist in interpreting the data, high collections times are shaded red while shorter collection times are shaded green. The size of each box in the treemap visualization represents the dollar value of each states accounts receivable balance, where larger smaller boxes mean higher lower dollar values. Use the visualizations to answer the following questions:
Step by Step Solution
There are 3 Steps involved in it
Step: 1

Get Instant Access to Expert-Tailored Solutions
See step-by-step solutions with expert insights and AI powered tools for academic success
Step: 2

Step: 3
Ace Your Homework with AI
Get the answers you need in no time with our AI-driven, step-by-step assistance
Get Started
Ai And The Lottery Defying Odds With Intelligent Prediction
Authors: Gary Covella Ph D
1st Edition
B0CND1ZB98, 979-8223302568