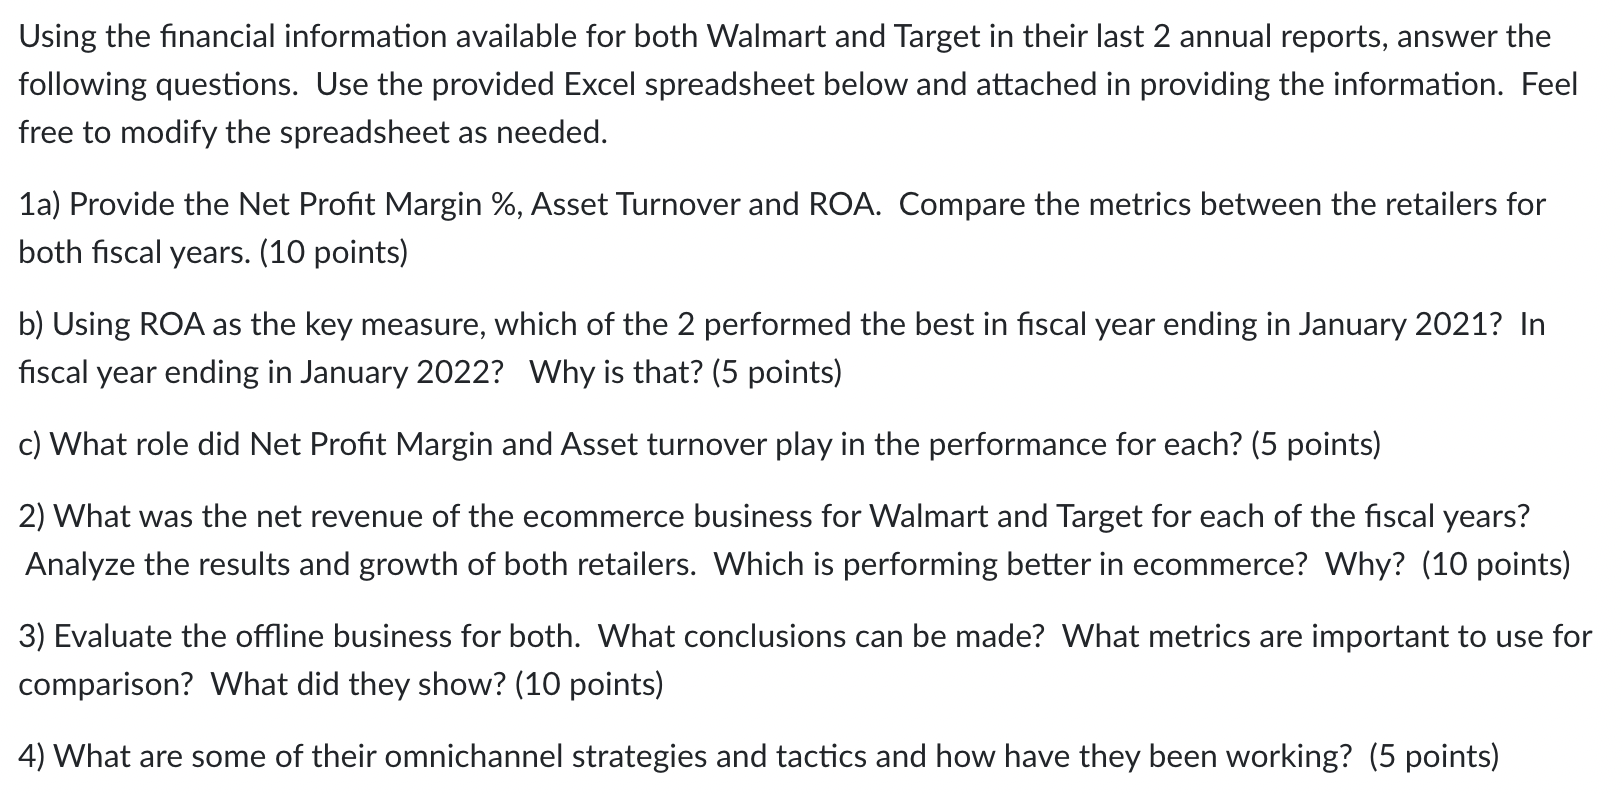
Target Financial Summary
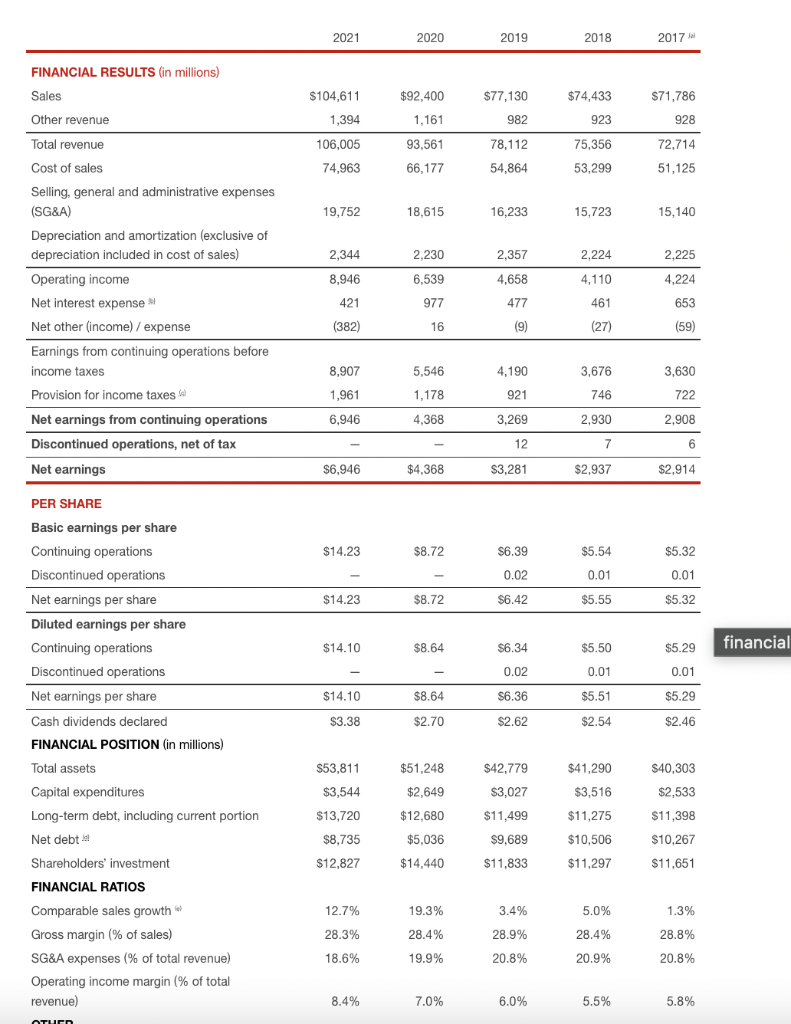 Walmart Financial Summary
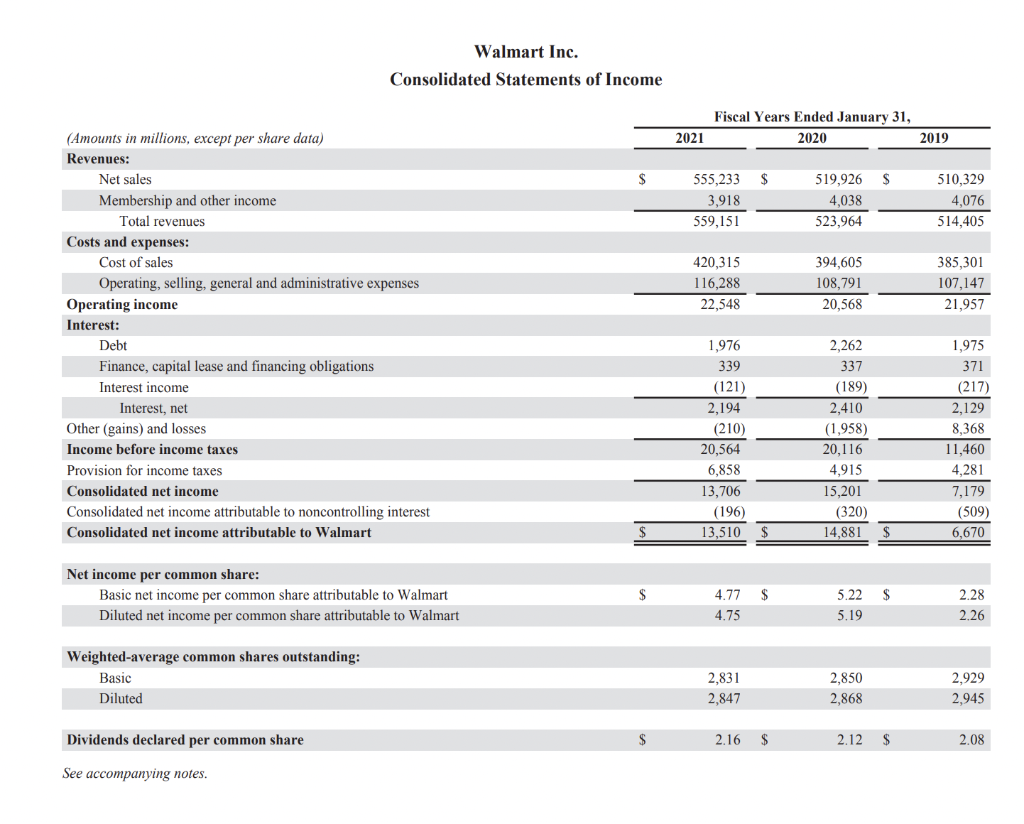
Using the financial information available for both Walmart and Target in their last 2 annual reports, answer the following questions. Use the provided Excel spreadsheet below and attached in providing the information. Feel free to modify the spreadsheet as needed. 1a) Provide the Net Profit Margin \%, Asset Turnover and ROA. Compare the metrics between the retailers for both fiscal years. (10 points) b) Using ROA as the key measure, which of the 2 performed the best in fiscal year ending in January 2021? In fiscal year ending in January 2022? Why is that? (5 points) c) What role did Net Profit Margin and Asset turnover play in the performance for each? (5 points) 2) What was the net revenue of the ecommerce business for Walmart and Target for each of the fiscal years? Analyze the results and growth of both retailers. Which is performing better in ecommerce? Why? (10 points) 3) Evaluate the offline business for both. What conclusions can be made? What metrics are important to use for comparison? What did they show? (10 points) 4) What are some of their omnichannel strategies and tactics and how have they been working? (5 points) \begin{tabular}{llllll} & 2021 & 2020 & 2019 & 2018 & 2017 ill \\ \hline \end{tabular} FINANCIAL RESULTS (in millions) PER SHARE Basic earnings per share \begin{tabular}{lrrrrr} Continuing operations & $14.23 & $8.72 & $6.39 & $5.54 & $5.32 \\ Discontinued operations & & & 0.02 & 0.01 & 0.01 \\ \hline Net earnings per share & $14.23 & $8.72 & $6.42 & $5.55 & $5.32 \\ \hline \end{tabular} Diluted earnings per share Continuing operations Discontinued operations Net earnings per share Cash dividends declared FINANCIAL POSITION (in millions) TotalassetsCapitalexpendituresLong-termdebt,includingcurrentportionNetdebt11Shareholdersinvestment$53,811$3,544$13,720$8,735$12,827$51,248$2,649$12,680$5,036$14,440$42,779$3,027$11,499$9,689$11,833$41,290$3,516$11,275$10,506$11,297$40,303$2,533$11,398$10,267$11,651 FINANCIAL RATIOS ComparablesalesgrowthGrossmargin(%ofsales)SG&Aexpenses(%oftotalrevenue)Operatingincomemargin(%oftotalrevenue)12.7%28.3%18.6%19.3%28.4%19.9%3.4%28.9%20.8%5.0%28.4%20.9%1.3%28.8%20.8% Walmart Inc. Walmart Inc. Consolidated Balance Sheets Using the financial information available for both Walmart and Target in their last 2 annual reports, answer the following questions. Use the provided Excel spreadsheet below and attached in providing the information. Feel free to modify the spreadsheet as needed. 1a) Provide the Net Profit Margin \%, Asset Turnover and ROA. Compare the metrics between the retailers for both fiscal years. (10 points) b) Using ROA as the key measure, which of the 2 performed the best in fiscal year ending in January 2021? In fiscal year ending in January 2022? Why is that? (5 points) c) What role did Net Profit Margin and Asset turnover play in the performance for each? (5 points) 2) What was the net revenue of the ecommerce business for Walmart and Target for each of the fiscal years? Analyze the results and growth of both retailers. Which is performing better in ecommerce? Why? (10 points) 3) Evaluate the offline business for both. What conclusions can be made? What metrics are important to use for comparison? What did they show? (10 points) 4) What are some of their omnichannel strategies and tactics and how have they been working? (5 points) \begin{tabular}{llllll} & 2021 & 2020 & 2019 & 2018 & 2017 ill \\ \hline \end{tabular} FINANCIAL RESULTS (in millions) PER SHARE Basic earnings per share \begin{tabular}{lrrrrr} Continuing operations & $14.23 & $8.72 & $6.39 & $5.54 & $5.32 \\ Discontinued operations & & & 0.02 & 0.01 & 0.01 \\ \hline Net earnings per share & $14.23 & $8.72 & $6.42 & $5.55 & $5.32 \\ \hline \end{tabular} Diluted earnings per share Continuing operations Discontinued operations Net earnings per share Cash dividends declared FINANCIAL POSITION (in millions) TotalassetsCapitalexpendituresLong-termdebt,includingcurrentportionNetdebt11Shareholdersinvestment$53,811$3,544$13,720$8,735$12,827$51,248$2,649$12,680$5,036$14,440$42,779$3,027$11,499$9,689$11,833$41,290$3,516$11,275$10,506$11,297$40,303$2,533$11,398$10,267$11,651 FINANCIAL RATIOS ComparablesalesgrowthGrossmargin(%ofsales)SG&Aexpenses(%oftotalrevenue)Operatingincomemargin(%oftotalrevenue)12.7%28.3%18.6%19.3%28.4%19.9%3.4%28.9%20.8%5.0%28.4%20.9%1.3%28.8%20.8% Walmart Inc. Walmart Inc. Consolidated Balance Sheets