

Answered step by step
Verified Expert Solution
Question
1 Approved Answer
target income statement target balance sheet walmart income statement walmart balance sheet industry averages A B D 12 Months Ended Jan 30, 2021 Feb. 01,
target income statement 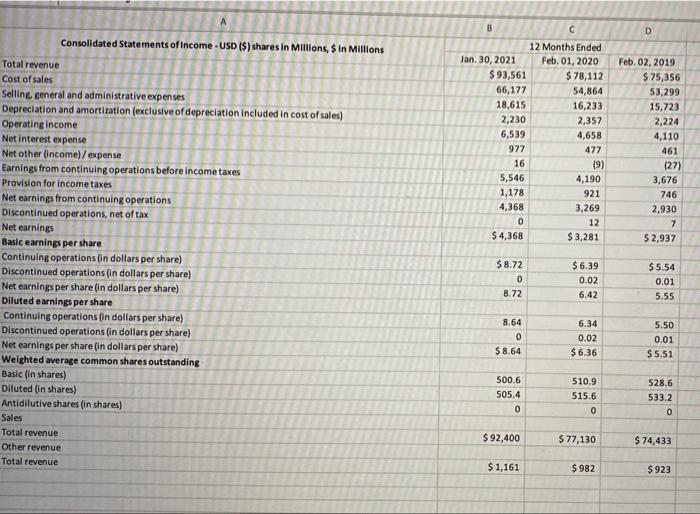
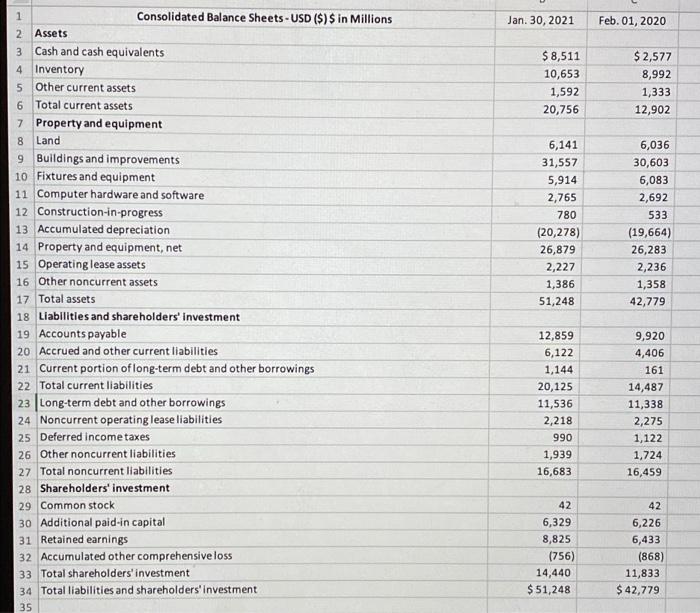
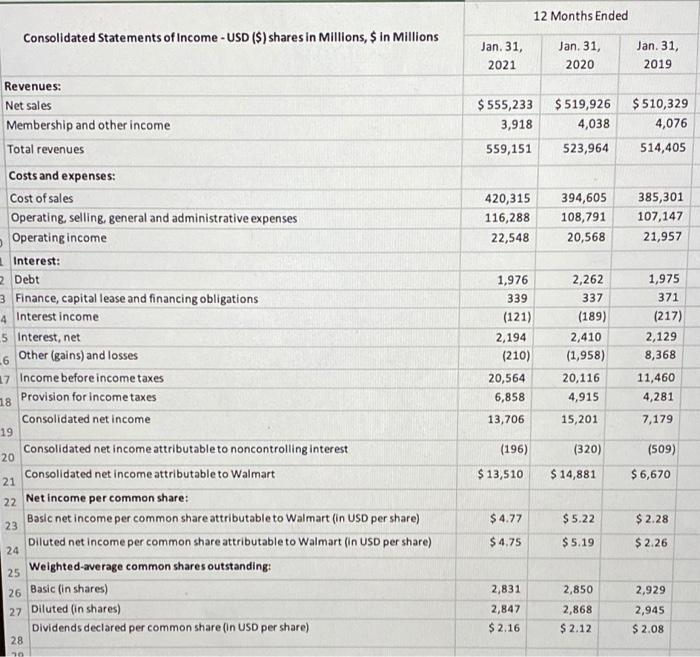
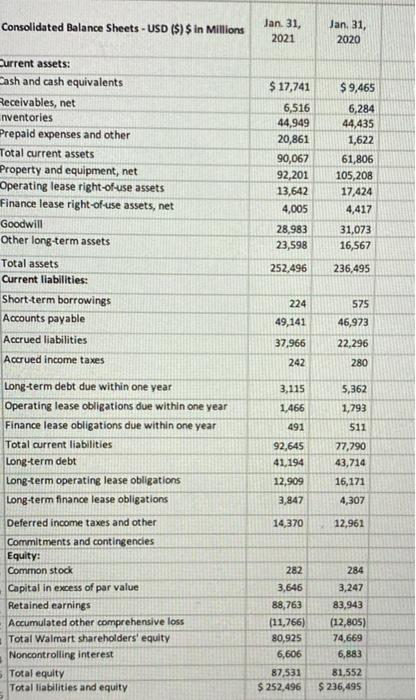
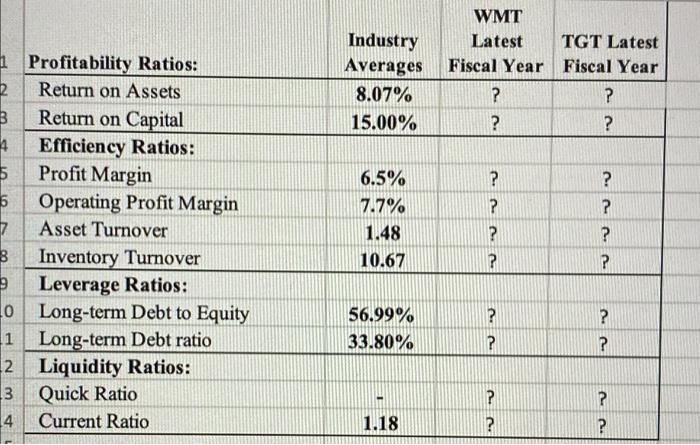
A B D 12 Months Ended Jan 30, 2021 Feb. 01, 2020 $ 93,561 $78,112 66,177 54,864 18,615 16,233 2,230 2,357 6,539 4,658 977 477 16 (9) 5,546 4,190 1,178 921 4,368 3,269 0 12 $4,368 $ 3,281 Feb. 02, 2019 $ 75,356 53,299 15,723 2,224 4,110 461 (27) 3,676 746 2.930 7 $ 2,937 Consolidated Statements of Income - USD ($) shares in Millions, $ in Millions Total revenue Cost of sales Selling general and administrative expenses Depreciation and amortization (exclusive of depreciation included in cost of sales) Operating income Net interest expense Net other (income)/expense Earnings from continuing operations before income taxes Provision for income taxes Net earnings from continuing operations Discontinued operations, net of tax Net earnings Basic earnings per share Continuing operations (in dollars per share) Discontinued operations (in dollars per share) Net earnings per share in dollars per share) Diluted earnings per share Continuing operations in dollars per share) Discontinued operations (in dollars per share) Net earnings per share (in dollars per share) Weighted average common shares outstanding Basic in shares) Diluted in shares) Antidilutive shares in shares) Sales Total revenue Other revenue Total revenue $8.72 0 8.72 $6.39 0.02 6.42 $5.54 0.01 5.55 8.64 0 $ 8.64 6.34 0.02 $6.36 5.50 0.01 $5.51 500.6 505.4 510.9 515.6 0 528.6 533.2 0 0 0 $ 92,400 $ 77,130 $ 74,433 $1,161 $982 $923 Jan. 30, 2021 Feb. 01, 2020 3 $ 8,511 10,653 1,592 20,756 $ 2,577 8,992 1,333 12,902 6,141 31,557 5,914 2,765 780 (20,278) 26,879 2,227 1,386 51,248 6,036 30,603 6,083 2,692 533 (19,664) 26,283 2,236 1,358 42,779 1 Consolidated Balance Sheets - USD ($) $ in Millions 2 Assets Cash and cash equivalents 4 Inventory 5 Other current assets 6 Total current assets 7 Property and equipment 8 Land 9 Buildings and improvements 10 Fixtures and equipment 11 Computer hardware and software 12 Construction-in-progress 13 Accumulated depreciation 14 Property and equipment, net 15 Operating lease assets 16 Other noncurrent assets 17 Total assets 18 Liabilities and shareholders' Investment 19 Accounts payable 20 Accrued and other current liabilities 21 Current portion of long-term debt and other borrowings 22 Total current liabilities 23 Long-term debt and other borrowings 24 Noncurrent operating lease liabilities 25 Deferred income taxes 26 Other noncurrent liabilities 27 Total noncurrent liabilities 28 Shareholders' investment 29 Common stock 30 Additional paid-in capital 31 Retained earnings 32 Accumulated other comprehensive loss 33 Total shareholders' investment 34 Total liabilities and shareholders' investment 35 12,859 6,122 1,144 20,125 11,536 2,218 990 1,939 16,683 9,920 4,406 161 14,487 11,338 2,275 1,122 1,724 16,459 42 42 6,329 8,825 (756) 14,440 $ 51,248 6,226 6,433 (868) 11,833 $ 42,779 12 Months Ended Consolidated Statements of Income - USD ($) shares in Millions, $ in Millions Jan. 31, 2021 Jan. 31, 2020 Jan. 31, 2019 $ 555,233 3,918 559,151 $ 519,926 4,038 523,964 $ 510,329 4,076 514,405 420,315 116,288 22,548 394,605 108,791 20,568 385,301 107,147 21,957 Revenues: Net sales Membership and other income Total revenues Costs and expenses: Cost of sales Operating, selling, general and administrative expenses Operating income Interest: 2 Debt 3 Finance, capital lease and financing obligations 4 Interest income 5 Interest, net .6 Other (gains) and losses 17 Income before income taxes 18 Provision for income taxes Consolidated net income 19 Consolidated net income attributable to noncontrolling interest 20 Consolidated net income attributable to Walmart 21 22 Net Income per common share: Basic net income per common share attributable to Walmart (in USD per share) 23 Diluted net income per common share attributable to Walmart (in USD per share) 24 25 Weighted-average common shares outstanding: 26 Basic (in shares) 27 Diluted (in shares) Dividends declared per common share in USD per share) 28 1,976 339 (121) 2,194 (210) 20,564 6,858 2,262 337 (189) 2,410 (1,958) 20,116 4,915 15,201 1,975 371 (217) 2,129 8,368 11,460 4,281 7,179 13,706 (196) (320) (509) $ 13,510 $ 14,881 $6,670 $4.77 $ 2.28 $5.22 $5.19 $4.75 $ 2.26 2,850 2,831 2,847 $ 2.16 2,868 $ 2.12 2,929 2,945 $ 2.08 10 Consolidated Balance Sheets - USD ($) $ in Millions Jan 31, 2021 Jan. 31, 2020 Current assets: Cash and cash equivalents Receivables, net nventories Prepaid expenses and other Total current assets Property and equipment, net Operating lease right-of-use assets Finance lease right-of-use assets, net Goodwill Other long-term assets $ 17,741 6,516 44,949 20,861 90,067 92,201 13,642 4,005 28,983 23,598 $ 9,465 6,284 44,435 1,622 61,806 105,208 17,424 4,417 31,073 16,567 252,496 236,495 Total assets Current liabilities: Short-term borrowings Accounts payable 224 575 46,973 49,141 Accrued liabilities 37,966 22,296 Accrued income taxes 242 280 3,115 5,362 1,793 1,466 491 511 92,645 41,194 77,790 43,714 16,171 4,307 12,909 3,847 Long-term debt due within one year Operating lease obligations due within one year Finance lease obligations due within one year Total current liabilities Long-term debt Long-term operating lease obligations Long-term finance lease obligations Deferred income taxes and other Commitments and contingencies Equity: Common stock Capital in excess of par value Retained earnings Accumulated other comprehensive loss Total Walmart shareholders' equity Noncontrolling interest 14,370 12,961 282 284 3,646 88,763 (11,766) 80,925 6,606 87,531 $ 252,496 3,247 83.943 (12,805) 74,669 6,883 Total equity Total liabilities and equity 81,552 $ 236,495 Industry Averages 8.07% 15.00% WMT Latest Fiscal Year ? TGT Latest Fiscal Year ? ? ? ? ? ? 1 Profitability Ratios: 2 Return on Assets B Return on Capital 4 Efficiency Ratios: 6 Profit Margin 5 Operating Profit Margin 7 Asset Turnover 3 Inventory Turnover Leverage Ratios: Lo Long-term Debt to Equity 1 Long-term Debt ratio 12 Liquidity Ratios: 3 Quick Ratio 4 Current Ratio 6.5% 7.7% 1.48 10.67 ? ? ? ? ? ? 56.99% 33.80% ? ? ? ? ? 1.18 ? ? A B D 12 Months Ended Jan 30, 2021 Feb. 01, 2020 $ 93,561 $78,112 66,177 54,864 18,615 16,233 2,230 2,357 6,539 4,658 977 477 16 (9) 5,546 4,190 1,178 921 4,368 3,269 0 12 $4,368 $ 3,281 Feb. 02, 2019 $ 75,356 53,299 15,723 2,224 4,110 461 (27) 3,676 746 2.930 7 $ 2,937 Consolidated Statements of Income - USD ($) shares in Millions, $ in Millions Total revenue Cost of sales Selling general and administrative expenses Depreciation and amortization (exclusive of depreciation included in cost of sales) Operating income Net interest expense Net other (income)/expense Earnings from continuing operations before income taxes Provision for income taxes Net earnings from continuing operations Discontinued operations, net of tax Net earnings Basic earnings per share Continuing operations (in dollars per share) Discontinued operations (in dollars per share) Net earnings per share in dollars per share) Diluted earnings per share Continuing operations in dollars per share) Discontinued operations (in dollars per share) Net earnings per share (in dollars per share) Weighted average common shares outstanding Basic in shares) Diluted in shares) Antidilutive shares in shares) Sales Total revenue Other revenue Total revenue $8.72 0 8.72 $6.39 0.02 6.42 $5.54 0.01 5.55 8.64 0 $ 8.64 6.34 0.02 $6.36 5.50 0.01 $5.51 500.6 505.4 510.9 515.6 0 528.6 533.2 0 0 0 $ 92,400 $ 77,130 $ 74,433 $1,161 $982 $923 Jan. 30, 2021 Feb. 01, 2020 3 $ 8,511 10,653 1,592 20,756 $ 2,577 8,992 1,333 12,902 6,141 31,557 5,914 2,765 780 (20,278) 26,879 2,227 1,386 51,248 6,036 30,603 6,083 2,692 533 (19,664) 26,283 2,236 1,358 42,779 1 Consolidated Balance Sheets - USD ($) $ in Millions 2 Assets Cash and cash equivalents 4 Inventory 5 Other current assets 6 Total current assets 7 Property and equipment 8 Land 9 Buildings and improvements 10 Fixtures and equipment 11 Computer hardware and software 12 Construction-in-progress 13 Accumulated depreciation 14 Property and equipment, net 15 Operating lease assets 16 Other noncurrent assets 17 Total assets 18 Liabilities and shareholders' Investment 19 Accounts payable 20 Accrued and other current liabilities 21 Current portion of long-term debt and other borrowings 22 Total current liabilities 23 Long-term debt and other borrowings 24 Noncurrent operating lease liabilities 25 Deferred income taxes 26 Other noncurrent liabilities 27 Total noncurrent liabilities 28 Shareholders' investment 29 Common stock 30 Additional paid-in capital 31 Retained earnings 32 Accumulated other comprehensive loss 33 Total shareholders' investment 34 Total liabilities and shareholders' investment 35 12,859 6,122 1,144 20,125 11,536 2,218 990 1,939 16,683 9,920 4,406 161 14,487 11,338 2,275 1,122 1,724 16,459 42 42 6,329 8,825 (756) 14,440 $ 51,248 6,226 6,433 (868) 11,833 $ 42,779 12 Months Ended Consolidated Statements of Income - USD ($) shares in Millions, $ in Millions Jan. 31, 2021 Jan. 31, 2020 Jan. 31, 2019 $ 555,233 3,918 559,151 $ 519,926 4,038 523,964 $ 510,329 4,076 514,405 420,315 116,288 22,548 394,605 108,791 20,568 385,301 107,147 21,957 Revenues: Net sales Membership and other income Total revenues Costs and expenses: Cost of sales Operating, selling, general and administrative expenses Operating income Interest: 2 Debt 3 Finance, capital lease and financing obligations 4 Interest income 5 Interest, net .6 Other (gains) and losses 17 Income before income taxes 18 Provision for income taxes Consolidated net income 19 Consolidated net income attributable to noncontrolling interest 20 Consolidated net income attributable to Walmart 21 22 Net Income per common share: Basic net income per common share attributable to Walmart (in USD per share) 23 Diluted net income per common share attributable to Walmart (in USD per share) 24 25 Weighted-average common shares outstanding: 26 Basic (in shares) 27 Diluted (in shares) Dividends declared per common share in USD per share) 28 1,976 339 (121) 2,194 (210) 20,564 6,858 2,262 337 (189) 2,410 (1,958) 20,116 4,915 15,201 1,975 371 (217) 2,129 8,368 11,460 4,281 7,179 13,706 (196) (320) (509) $ 13,510 $ 14,881 $6,670 $4.77 $ 2.28 $5.22 $5.19 $4.75 $ 2.26 2,850 2,831 2,847 $ 2.16 2,868 $ 2.12 2,929 2,945 $ 2.08 10 Consolidated Balance Sheets - USD ($) $ in Millions Jan 31, 2021 Jan. 31, 2020 Current assets: Cash and cash equivalents Receivables, net nventories Prepaid expenses and other Total current assets Property and equipment, net Operating lease right-of-use assets Finance lease right-of-use assets, net Goodwill Other long-term assets $ 17,741 6,516 44,949 20,861 90,067 92,201 13,642 4,005 28,983 23,598 $ 9,465 6,284 44,435 1,622 61,806 105,208 17,424 4,417 31,073 16,567 252,496 236,495 Total assets Current liabilities: Short-term borrowings Accounts payable 224 575 46,973 49,141 Accrued liabilities 37,966 22,296 Accrued income taxes 242 280 3,115 5,362 1,793 1,466 491 511 92,645 41,194 77,790 43,714 16,171 4,307 12,909 3,847 Long-term debt due within one year Operating lease obligations due within one year Finance lease obligations due within one year Total current liabilities Long-term debt Long-term operating lease obligations Long-term finance lease obligations Deferred income taxes and other Commitments and contingencies Equity: Common stock Capital in excess of par value Retained earnings Accumulated other comprehensive loss Total Walmart shareholders' equity Noncontrolling interest 14,370 12,961 282 284 3,646 88,763 (11,766) 80,925 6,606 87,531 $ 252,496 3,247 83.943 (12,805) 74,669 6,883 Total equity Total liabilities and equity 81,552 $ 236,495 Industry Averages 8.07% 15.00% WMT Latest Fiscal Year ? TGT Latest Fiscal Year ? ? ? ? ? ? 1 Profitability Ratios: 2 Return on Assets B Return on Capital 4 Efficiency Ratios: 6 Profit Margin 5 Operating Profit Margin 7 Asset Turnover 3 Inventory Turnover Leverage Ratios: Lo Long-term Debt to Equity 1 Long-term Debt ratio 12 Liquidity Ratios: 3 Quick Ratio 4 Current Ratio 6.5% 7.7% 1.48 10.67 ? ? ? ? ? ? 56.99% 33.80% ? ? ? ? ? 1.18 target balance sheet
walmart income statement
walmart balance sheet
industry averages
Step by Step Solution
There are 3 Steps involved in it
Step: 1

Get Instant Access to Expert-Tailored Solutions
See step-by-step solutions with expert insights and AI powered tools for academic success
Step: 2

Step: 3
Ace Your Homework with AI
Get the answers you need in no time with our AI-driven, step-by-step assistance
Get Started
Investing For Women Smart Strategies To Start Investing Now With Confidence Low Risk And Minimal Effort
Authors: Mike Hartley ,Hannah Rosenstein
1st Edition
979-8393237202