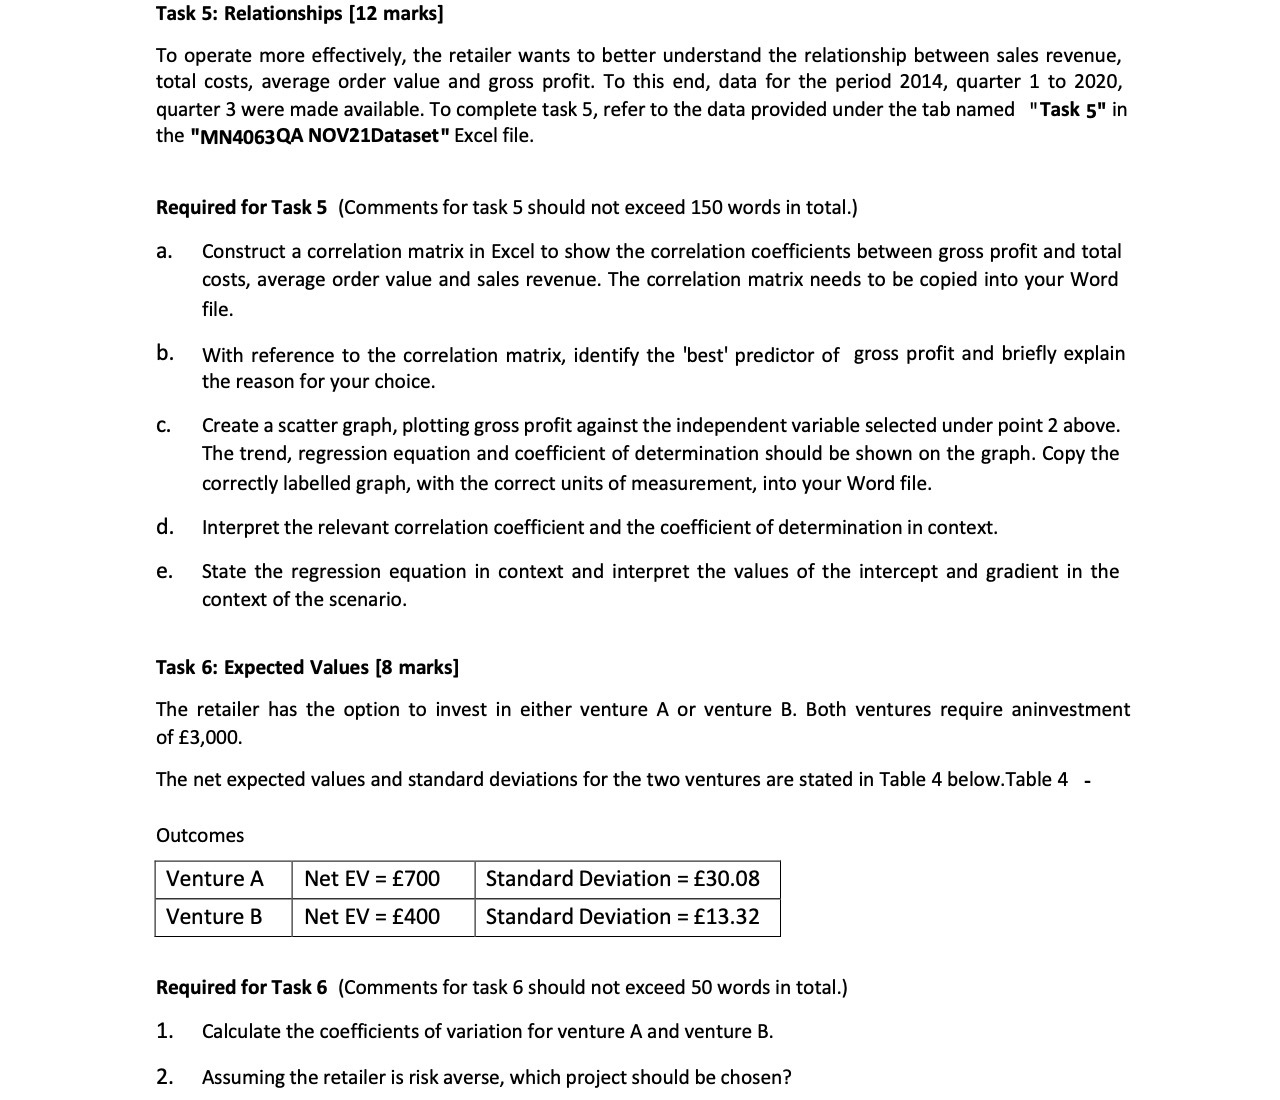
Task 5: Relationships [12 marks] To operate more effectively, the retailer wants to better understand the relationship between sales revenue, total costs, average order value and gross prot. To this end, data for the period 2014, quarter 1 to 2020, quarter 3 were made available. To complete task 5, refer to the data provided under the tab named "Task 5" in the "MN4063QA NOVZIDataset" Excel le. Required for Task 5 {Comments for task 5 should not exceed 150 words in total.) 3. Construct a correlation matrix in Excel to show the correlation coefcients between gross profit and total costs, average order value and sales revenue. The correlation matrix needs to be copied into your Word file. b. With reference to the correlation matrix, identify the 'best' predictor of gross profit and briey explain the reason for your choice. c. Create a scatter graph, plotting gross prot against the independent variable selected under point 2 above. The trend, regression equation and coefficient of determination should be shown on the graph. Copy the correctly labelled graph, with the correct units of measurement, into your Word file. d. Interpret the relevant correlation coefcient and the coefficient of determination in context. 8. State the regression equation in context and interpret the values of the intercept and gradient in the context of the scenario. Task 6: Expected Values [8 marks] The retailer has the option to invest in either venture A or venture B. Both ventures require aninvestment of 3,000. The net expected values and standard deviations for the two ventures are stated in Table 4 below.Table 4 - Outcomes Net EV = 700 Standard Deviation = 30.03 Venture B Net EV = E400 Standard Deviation = 13.32 Required for Task 6 (Comments for task 6 should not exceed 50 words in total.) 1. Calculate the coefcients of variation for venture A and venture B. 2. Assuming the retailer is risk averse, which project should be chosen