

Question
Task 5: With the either portfolio, create a table that shows the benefit of diversification using Data Table in Excel. (Note that the table shows
Task 5:
With the either portfolio, create a table that shows the benefit of diversification using Data Table in Excel. (Note that the table shows portfolio returns and portfolio standard deviation with respect to scenarios of weights on one of the stocks of your choosing from the portfolio)
Task 6:
Using the table obtained from problem 6, Plot expected returns against portfolio risk (standard deviations) displaying efficient portfolios.
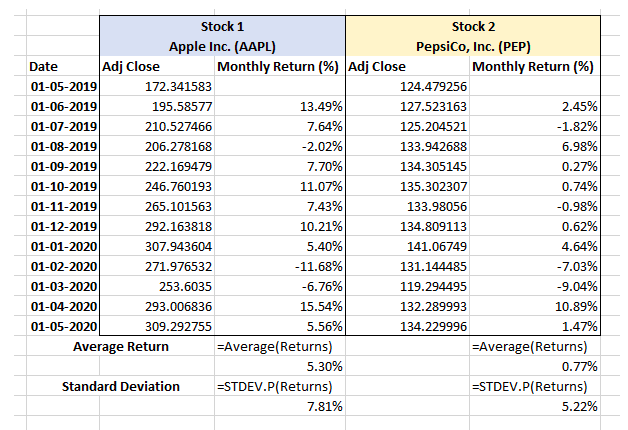
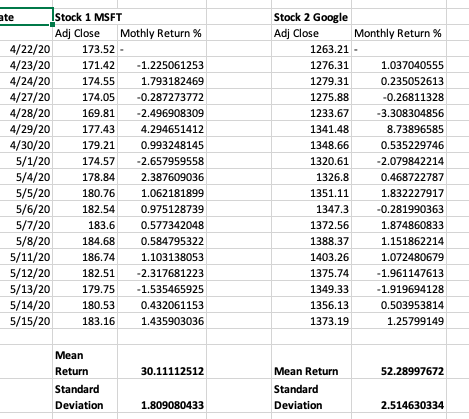
Stock 1 Stock 2 Apple Inc. (AAPL) PepsiCo, Inc. (PEP) Date Adj Close Monthly Return (%) Adj Close Monthly Return (%) 01-05-2019 172.341583 124.479256 01-06-2019 195.58577 13.49% 127.523163 2.45% 01-07-2019 210.527466 7.64% 125.204521 -1.82% 01-08-2019 206.278168 -2.02% 133.942688 6.98% 01-09-2019 222.169479 7.70% 134.305145 0.27% 01-10-2019 246.760193 11.07% 135.302307 0.74% 01-11-2019 265.101563 7.43% 133.98056 -0.98% 01-12-2019 292.163818 10.21% 134.809113 0.62% 01-01-2020 307.943604 5.40% 141.06749 4.64% 01-02-2020 271.976532 -11.68% 131.144485 -7.03% 01-03-2020 253.6035 -6.76% 119.294495 -9.04% 01-04-2020 293.006836 15.54% 132.289993 10.89% 01-05-2020 309.292755 5.56% 134.229996 1.47% Average Return =Average(Returns) =Average(Returns) 5.30% 0.77% Standard Deviation ESTDEV.P(Returns) =STDEV.P(Returns) 7.81% 5.22% ate Stock 1 MSFT Adj Close Mothly Return% 4/22/20 173.52 - 4/23/20 171.42 -1.225061253 4/24/20 174.55 1.793182469 4/27/20 174.05 -0.287273772 4/28/20 169.81 -2.496908309 4/29/20 177.43 4.294651412 4/30/20 179.21 0.993248145 5/1/20 174.57 -2.657959558 5/4/20 178.84 2.387609036 5/5/20 180.76 1.062181899 5/6/20 182.54 0.975128739 5/7/20 183.6 0.577342048 5/8/20 184.68 0.584795322 5/11/20 186.74 1.103138053 5/12/20 182.51 -2.317681223 5/13/20 179.75 -1.535465925 5/14/20 180.53 0.432061153 5/15/20 183.16 1.435903036 Stock 2 Google Adj Close Monthly Return % 1263.21 - 1276.31 1.037040555 1279.31 0.235052613 1275.88 -0.26811328 1233.67 -3.308304856 1341.48 8.73896585 1348.66 0.535229746 1320.61 -2.079842214 1326.8 0.468722787 1351.11 1.832227917 1347.3 -0.281990363 1372.56 1.874860833 1388.37 1.151862214 1403.26 1.072480679 1375.74 -1.961147613 1349.33 -1.919694128 1356.13 0.503953814 1373.19 1.25799149 Mean Return 30.11112512 52.28997672 Standard Deviation Mean Return Standard Deviation 1.809080433 2.514630334
Step by Step Solution
There are 3 Steps involved in it
Step: 1

Get Instant Access to Expert-Tailored Solutions
See step-by-step solutions with expert insights and AI powered tools for academic success
Step: 2

Step: 3
Ace Your Homework with AI
Get the answers you need in no time with our AI-driven, step-by-step assistance
Get Started
Enhancing Financial Inclusion Through Islamic Finance Volume II
Authors: Abdelrahman Elzahi Saaid Ali , Khalifa Mohamed Ali , Mohamed Hassan Azrag
1st Edition