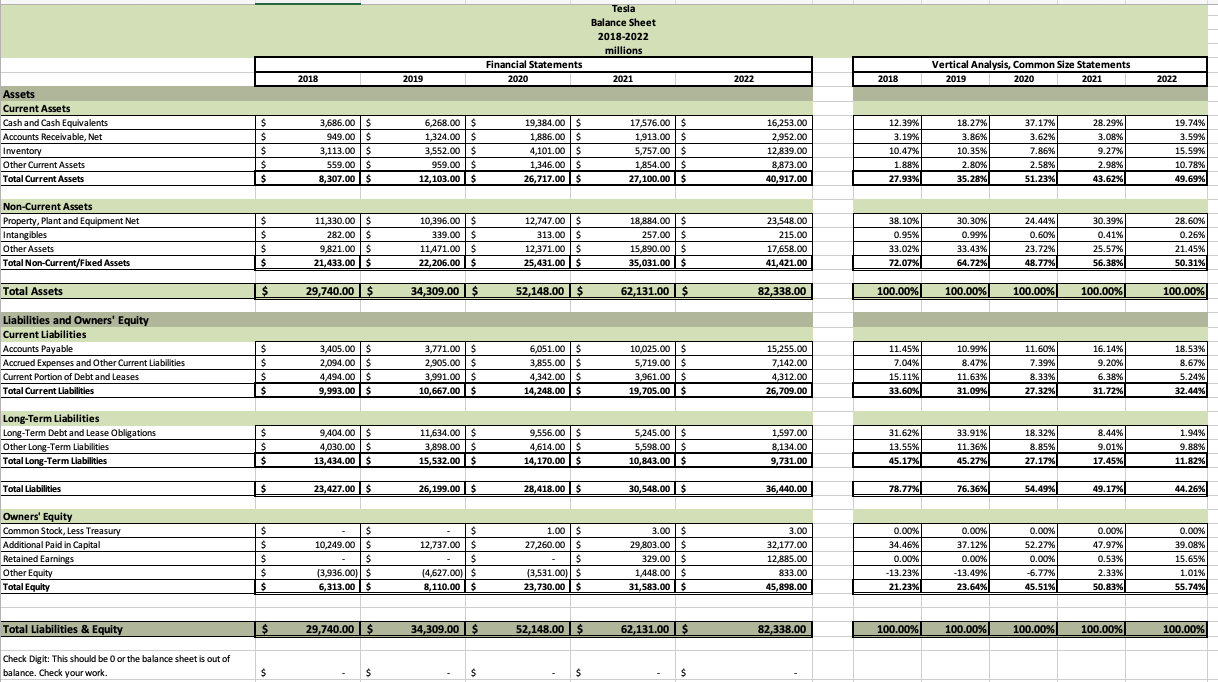
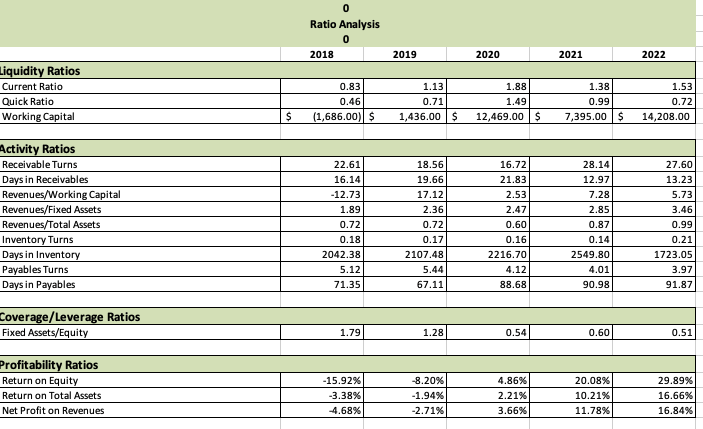
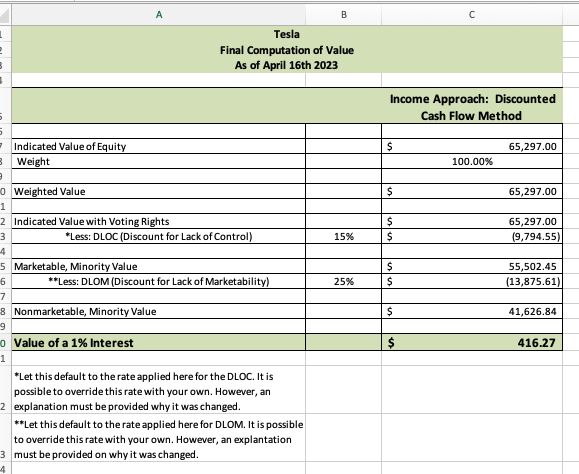
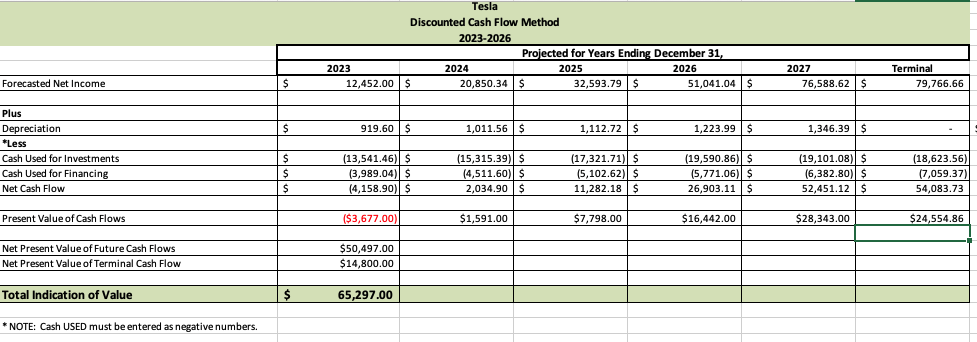
Tesla Balance Sheet 2018-2022 millions Financial Statements 2018 2019 2020 Vertical Analysis, Common Size Statements 2021 2022 Assets 2018 2019 2020 2021 2022 Current Assets Cash and Cash Equivalents 3,686.00 S 6,268.00 5 Accounts Receivable, Net 19,384.00 5 17,576.00 S 16,253.00 949.00 $ 12.39%% 1,324.00 $ 18.27% 37.17% 28.29% 19.74% Inventory 1,886.00 S 1,913.00 $ 3,113.00 $ 2,952.00 3,552.00 $ 3.19% 3.86% 3.08% 3.59% Other Current Assets 4,101.00 $ 5,757.00 $ 3.62% 12,839.00 559.00 $ 10.47% 959.00 $ 10.35% Total Current Assets 1,346.00 $ 7.86% 1 854.00 $ 9.27%% 15.59% 8,307.00 $ 8,873.00 1.88% 12,103.00 $ 2.80% 26,717.00 $ 2.58%% 2.98% 27,100.00 $ 10.78%% 40,917.00 17.93% 35.28% 51.23% 13.62% 19.69% Non-Current Assets Property, Plant and Equipment Net 11,330.00 $ 10,396.00 | $ Intangible 12,747.00 $ 18,884.00 $ 23,548.00 282.00 $ 38. 10%% 339.00 $ 10.30% 313.00 24.44% 10.39% Other Assets $ 28.60% 215.00 9,821.00 $ 11,471.00 |$ 0.95% 0.99%% D.60% 0.41% 0.26% Total Non-Current/Fixed Assets 12,371.00 S 15,890.00 5 21,433.00 $ 17,658.00 22,206.00 $ 83.02%% 83.43% 25,431.00 $ 23.72% 35,031.00 25.57% 21.45% 41,421.00 2.07% 64.72% 48.77% 56.38% 50.31% Total Assets S 29,740.00 $ 34,309.00 $ 52,148.00 $ 62,131.00 $ 82,338.00 100.00% 100.00% 100.00% 100.00% 100.00% Liabilities and Owners' Equity Current Liabilities Accounts Payable 3,405.00 $ 3,771.00 $ 6,051.00 $ Accrued Expenses and Other Current Liabilities 10,025.00 $ 15,255.00 2,094.00 $ 11.45% 2,905.00 $ 10.99% 3,855.00 5 11.60% 16.14% Current Portion of Debt and Leases 5,719.00 $ 18.53% 7,142.00 4,494.00 $ 3,991.00 $ 7.04% 8.47% 1,342.00 $ 7.39% 9.20% Total Current Liabilities 3,961.00 $ 8.67% 9,993.00 | $ 1,312.00 10,667.00 $ 15.11% 14,248.00 $ 11.63% 3.33%% 5.38% 19,705.00 $ 5.24% 26,709.00 13.60% 31.09% 27.32% 1.72% 32.44% Long-Term Liabilities Long-Term Debt and Lease Obligations 9,404.00 5 11,634.00 $ Other Long-Term Liabilities 9,556.00 S 5,245.00 $ 4,030.00 S 1,597.00 3,898.00 5 31.62% 33.91% 18.32% 1.94% Total Long-Term Liabilities 4,614.00 5 8.44% 5,598.00 $ 13,434.00 $ 8,134.00 15,532.00 $ 3.55% 14,170.00 $ 11.36% B.85% 10,843.00 $ 9.01% 9.889% ,731.00 45.17% 45.27% 27.17% 17.45% 11.82% Total Liabilities 23,427.00 $ 26, 199.00 $ 28, 418.00 30,548.00 $ 36,440.00 78.77% 76.36% 54.49% 9.17% 14.26% Owners' Equity Common Stock, Less Treasury S S Additional Paid in Capital S 1.00 3 1.00 $ 3.00 10,249.00 | $ 0.00% 12,737.00 $ 0.00% 27,260.00 5 D.00% 09,803.00 $ 0.00% 0.00%% Retained Earning S 32,177.00 34.46% 87.12% 52.27%% Other Equit 329.00 5 17.97% 39.08%% 2,885.00 3,936.00)| $ 0.00% 4,627.00) $ 0.00% 3,531.00] D.00% .539 1,448.00 5 15.65% Total Equity 6,313.00 $ 833.00 8,110.00 $ 13.23% 23,730.00 $ 13.49% 1,583.00 $ 6.77% 2.33%% 1.01% 15,898.00 1.23% 23.64% 15.51% 50.83% 65.74% Total Liabilities & Equity $ 29,740.00 $ 34,309.00 $ 52,148.00 $ 62,131.00 $ 82,338.00 100.00% 100.00% 100.00% 100.00% 100.00% Check Digit: This should be 0 or the balance sheet is out of balance. Check your work. $0 Income Statement Financial Statements Vertical Analysis, Common Size Statements 2018 2019 2020 2021 2022 2018 2019 2020 2021 Total Revenue ( or Sales ] 2022 21,461 00 24,578 00 31,536.00 53,823.00 $ 81,462 00 100 009 100 005 100 00% 100.0095 100 00% Cost of Sales 17,419 00 S 20,509.00 24,906.00 $ 40,217 00 60,609.00 81.17% 83.44% 8.98%% 74.72%% 74.40% Gross Profit 4,042.00 $ 4 069.00 $ 6 630.00 5 13,606.00 $ 20,853.00 18.83% 16.56% 21.02% 25.28% 25.60% Sales, General, and Administrative Expenses $ 4,430 00 $ 4,138 00 $ 4,636 00 | $ 7,083 00 $ 7,197.00 20.6495 16.8495 14.70% 13.16% 8.83% Operating Income (388.00) $ (69.00) $ 1,994.00 5 6 523.00 5 13,656.00 -1.81% -0.28% 6.32% 12.12% 16.76% Other Income (Expense) *If expense is reported, enter as a negative number. Interest Income / ( Expense] $ (639 00] $ (641 00) $ 718 00] $ (315 00] $ 106 00 2.98% -2.619% 2.2895 0.59% 0.1395 Other Income ( Expense) 22 00 | $ 45.00 122 00] $ 135 00 | $ (43.00] 0.10% D. 18% 0.39% 0.25% 0.05% Net Income (Loss], Before Tax $ (1 005 00) $ (665 001 $ 1 154.00 $ 6 343.00 $ 13 719.00 -4.68% -2.71% 3.66% 11.78% 16.84% Vertical Analysis on Revenue Only 14.52% 28.31% 70.67% 51.35%Ratio Analysis 2018 2019 2020 2021 2022 Liquidity Ratios Current Ratio 0.83 1.13 1.88 1.38 1.53 Quick Ratio D.46 D.71 1.49 D.99 D.72 Working Capital S (1,686.00) $ 1,436.00 $ 12,469.00 $ 7,395.00 $ 14,208.00 Activity Ratios Receivable Turns 22.61 18.56 16.72 28.14 27.60 Days in Receivables 16.14 19.66 21.83 12.97 13.23 Revenues/Working Capital -12.73 17.12 2.53 7.28 5.73 Revenues/Fixed Assets 1.89 2.36 2.47 2.85 3.46 Revenues/Total Assets 0.72 0.72 D.60 D.87 0.99 Inventory Turns 0.18 0.17 D.16 D.14 D.21 Days in Inventory 2042.38 2107.48 2216.70 2549.80 1723.05 Payables Turns 5.12 5.44 4.12 4.01 3.97 Days in Payables 71.35 67.11 88.68 90.98 91.87 Coverage/ Leverage Ratios Fixed Assets/Equity 1.79 1.28 0.54 0.60 D.51 Profitability Ratios Return on Equity -15.92%% 8.20% 1.86% 20.08%% 29.89% Return on Total Assets -3.38% -1.94% 2.21% 10.21% 16.66% Net Profit on Revenues -4.68% -2.71% 3.66% 11.78% 16.84Tesla Project Income Statements 2023-2026 millions Financial Statements 2023 2024 2025 2026 2027 Termina Total Revenue (or Sales) 115032.4902 $ 174,291.48 $ 259,016.31 $ 395,443.31 $ 589,493.03 $ 651,979.29 Estimated Annual Revenue Growth Rate 41.21%% 51.52% 48.61% 52.67% 49.07% 10.60% Gross Profit 29,448.32 $ 44,618.62 $ 66,308.17 $ 101,233.49 $ 150,910.22 $ 166,906.70 Estimated Annual Gross Profit Margin 25.60% 25.60%% 25.60% 25.60% 25.60% 25.60% Sales, General, and Administrative Expenses (SG&A) $ 17,059.32 |$ 23,831.28 $ 33,777.38 $ 50,255.45 | $ 74,384.60 $ 87,203.03 Estimated Annual SG&A (% of Sales) 14.83% 13.67% 13.04% 12.71% 12.62%% 13.38%% Other Income (Expense) "If expense is reported, enter as a negative number. Interest Income / (Expense) 106.00 $ 106.00 $ 106.00 $ 106.00 | $ 106.00 $ 106.00 Other Income (Expense) S (43.00) $ (43.00) $ (43.00) $ (43.00) $ (43.00) $ (43.00) Net Income (Loss) $ 12,452.00 $ 20,850.34 $ 32,593.79 $ 51,041.04 $ 76,588.62 $ 79,766.66A B C Tesla Final Computation of Value As of April 16th 2023 Income Approach: Discounted Cash Flow Method Indicated Value of Equity S 65,297.00 Weight 100.00% Weighted Value S 65,297.00 Indicated Value with Voting Rights 65,297.00 *Less: DLOC (Discount for Lack of Control) 15% (9,794.55) Marketable, Minority Value 55,502.45 **Less: DLOM (Discount for Lack of Marketability) 25% (13,875.61) Nonmarketable, Minority Value S 41,626.84 Value of a 1% Interest 416.27 *Let this default to the rate applied here for the DLOC. It is possible to override this rate with your own. However, an explanation must be provided why it was changed. **Let this default to the rate applied here for DLOM. It is possible to override this rate with your own. However, an explantation must be provided on why it was changed.Tesla Discounted Cash Flow Method 2023-2026 Projected for Years Ending December 31, 2023 2024 2025 2026 2027 Terminal Forecasted Net Income S 12,452.00 | S 20,850.34 $ 32,593.79 |$ 51,041.04 S 76,588.62 5 79,766.66 Plus Depreciation $ 919.60 |$ 1,011.56 $ 1,112.72 $ 1,223.99 S 1,346.39 #Less Cash Used for Investments S (13,541.46) $ (15,315.39) $ (17,321.71) $ 19,590.86) $ (19,101.08) $ (18,623.56) Cash Used for Financing (3,989.04) $ (4,511.60) | $ (5,102.62) $ (5,771.06) $ (6,382.80) $ (7,059.37) Net Cash Flow S (4,158.90) $ 2,034.90 | $ 11,282.18 26,903.11 S 52,451.12 S 54,083.73 Present Value of Cash Flows ($3,677.00) $1,591.00 $7,798.00 $16,442.00 $28,343.00 $24,554.86 Net Present Value of Future Cash Flows $50,497.00 Net Present Value of Terminal Cash Flow $14,800.00 Total Indication of Value 65,297.00 *NOTE: Cash USED must be entered as negative numbers


