

Question
Tesla's stock price hit historical high recently, which created a legend in the stock market. How much is the firm's estimated market value in Aug
 Tesla's stock price hit historical high recently, which created a legend in the stock market. How much is the firm's estimated market value in Aug 2020?
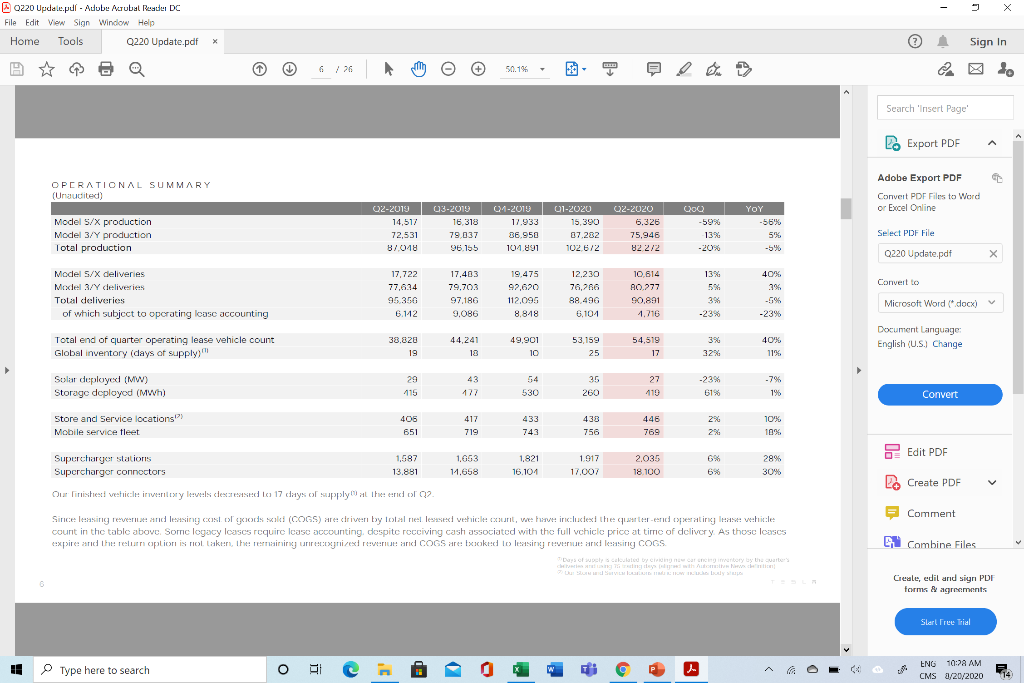
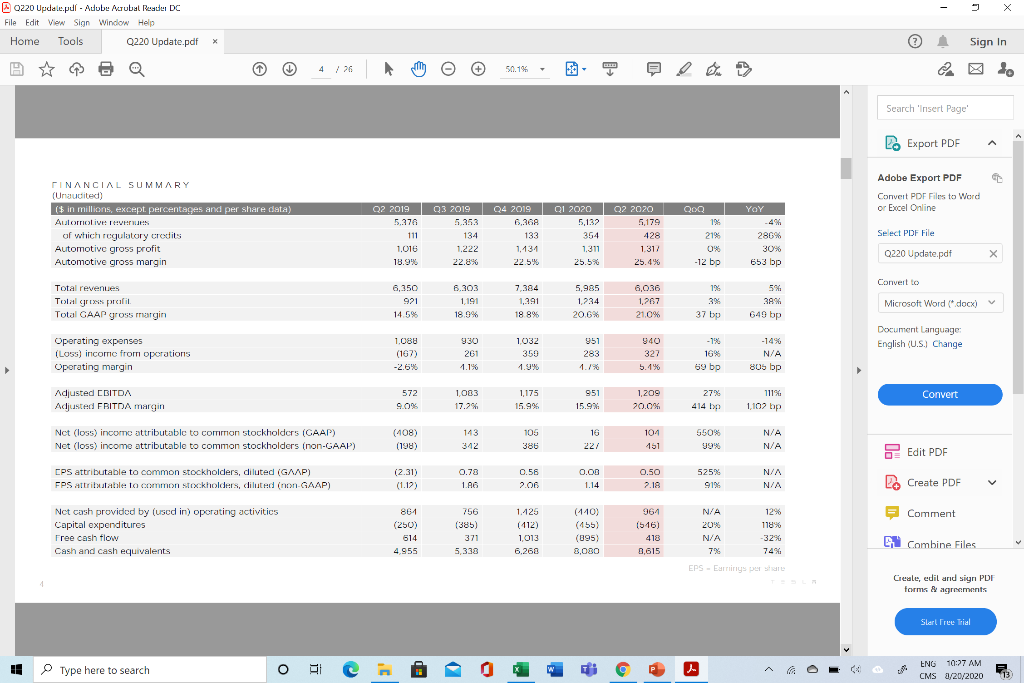
Read Tesla 2020 Q2 Financial Statements. How much the company's total assets value? Is there a significant difference between the book value and market value? Why?
0220 Update.pdf - Adobu Marubial Meather DC File Edit View Sign Window Helio Home Tools Q220 Update.pdf X Sign In 50.19 Search 'Insert Page D. Export PDF OPERATIONAL SUMMARY (Unaudited) Adobe Export PDF Convert PDF Files to Word or Excel Online Model 5/X production Model 3/Y production Total production 02-2019 03-2019 01-2010 14,517 16,318 17.933 72,531 79.037 36.950 8/018 96.155 101.991 01-2020 15,390 87.282 102 612 02-2020 6.326 75,946 82 2/2 000 -59% 13% YOY -56% 5% -5% % Select PDF File 0220 Update.pdf X 17.403 Convert to Model 5/X deliveries Mexdel 3/Y deliveries Total deliveries of which subject to operating lease accounting 17,722 77,634 95.350 6.142 79.703 97,186 9,086 19,475 92,620 112,095 8.818 12,230 76,20 89.496 6,104 10.614 A0.277 90,891 1,716 13% 5% 39 -23% 40% 3% -5% -23% Microsoft Word (.docx) 49.901 Total end of quarter operating lease vehicle count Global inventory (days of supply 38.820 19 44,241 18 53,159 25 54,519 17 40% 11%. Document Language English (U.S. Change 10 32% 29 43 Solar deployed (MW) Storage deployed (MWh) 54 530 25 260 27 119 -23% 61% -7% 1% 115 Convert 2% Store ancl Service locations Mobile service fleet 405 651 417 719 433 743 438 756 446 769 10% 10% Edit PDF 6% Supercharger stations Supercharger connectors 1,587 13.881 1.653 11.658 1.821 16.101 1.917 17.007 2.035 18.100 28% 30% 6% L. Create PDF Our lixheri vehicle inventary levels cleared 17 days of supply the end of 02. = Comment Since leasing reverse and leasing cool code schi (COGS) are chriver by balrellessed vehicle exunt, we have include the quarterend operating lase verile count in the table above. Somc legacy cases require lease accounting, despite recciving cash associated with the full vchicle price at time of delivery. As those leases eexpire and the return caption is not taken the remaining unrecognized revenue and COGS are txoked to leasing revenue and lessing COGS Dayscy calculated by Cincarchengimatory by the waters SSV W Combine Files Creale, edit and sign PDF forms & agreements Sarl Free Trial Type here to search oc ENG 10:28 AM CMS 1/20/2020 14 0220 Update.pdf - Adobu Marubial Meather DC File Edit View Sign Window Helio Home Tools Q220 Update.pdf X Sign In 50.19 e Search 'Insert Page D. Export PDF Adobe Export PDF Convert PDF Files to Word or Excel Online QOQ FINANCIAL SUMMARY (Unaudited) ($ in millions, except percentages and per share data) Automotive TV of which regulatory credits Automotive gross profit Automotive gross margin 19 Q2 2019 03 2019 Q4 2019 QL 2020 Q2 2020 5,376 5.353 6,36A 5,132 5,179 111 134 133 354 428 1,016 1.222 1.131 1.311 1.317 18.9% 22.8% 22.5% 25.5% 25.4% YOY -4% 286% 30% 653 bp 21% 0% -12 bp Select PDF File Q220 Update.pdf X Convert to Total revenues Total gres porci Total GAAP gross margin 6,350 921 6.303 1,191 18.99 7,384 1,391 18 8% 5,985 1,234 20.6% 6,036 1,267 21.0% 1% 39 37 bp 5% 39% 649 bp Microsoft Word (.docx) 930 Document Language English (U.S. Change Operating expenses (Loss) income from operations Operating margin 1.088 (167) -2.6% 261 1.1% 1032 359 1.9% 951 283 1.7% 327 5.1% -7% 16% 69 bp -14% N/A 805 bp 572 Adjusted EBITDA Adjusted FBITDA margin 1003 17.24 1.175 15.9% Convert 951 15.9 1,209 20.0% 27% 414 In 111% % 1,102 bp 550% % Nct (loss) income attributablc to common stockholders (GAAP) Net (loss) income attributable to common stockholders (non-GAAP) (108) (198) 143 342 105 386 16 22/ 101 151 N/A N/A Edit PDF EPS attributable to common stockholders, diluted (GAP) FPS attributable to common stockholders, diluted (non-GAAP) (2.31) (1.12) 0.78 LAG 0.56 2.06 0.00 1.14 0.50 2.18 525 9196 N/A N/A L. Create PDF = Comment Nct cash provided by (used in) operating activitics Capital expenditures Free cash flow Cash and cash equivalents 861 (250) 614 4.955 756 (385) 371 5,333 1.425 (412) 1,013 6,268 (110) (455) (895) 8,080 961 1516) 418 0,615 NA 20% N/A 7% 12% 118% -32% 74% W Combine Files EPS - Earrings Der Star Creale, edit and sign PDF forms & agreements Sarl Free Trial Type here to search oc ** ENG 10:27 AM CMS 1/20/2020 13 0220 Update.pdf - Adobu Marubial Meather DC File Edit View Sign Window Helio Home Tools Q220 Update.pdf X Sign In 50.19 Search 'Insert Page D. Export PDF OPERATIONAL SUMMARY (Unaudited) Adobe Export PDF Convert PDF Files to Word or Excel Online Model 5/X production Model 3/Y production Total production 02-2019 03-2019 01-2010 14,517 16,318 17.933 72,531 79.037 36.950 8/018 96.155 101.991 01-2020 15,390 87.282 102 612 02-2020 6.326 75,946 82 2/2 000 -59% 13% YOY -56% 5% -5% % Select PDF File 0220 Update.pdf X 17.403 Convert to Model 5/X deliveries Mexdel 3/Y deliveries Total deliveries of which subject to operating lease accounting 17,722 77,634 95.350 6.142 79.703 97,186 9,086 19,475 92,620 112,095 8.818 12,230 76,20 89.496 6,104 10.614 A0.277 90,891 1,716 13% 5% 39 -23% 40% 3% -5% -23% Microsoft Word (.docx) 49.901 Total end of quarter operating lease vehicle count Global inventory (days of supply 38.820 19 44,241 18 53,159 25 54,519 17 40% 11%. Document Language English (U.S. Change 10 32% 29 43 Solar deployed (MW) Storage deployed (MWh) 54 530 25 260 27 119 -23% 61% -7% 1% 115 Convert 2% Store ancl Service locations Mobile service fleet 405 651 417 719 433 743 438 756 446 769 10% 10% Edit PDF 6% Supercharger stations Supercharger connectors 1,587 13.881 1.653 11.658 1.821 16.101 1.917 17.007 2.035 18.100 28% 30% 6% L. Create PDF Our lixheri vehicle inventary levels cleared 17 days of supply the end of 02. = Comment Since leasing reverse and leasing cool code schi (COGS) are chriver by balrellessed vehicle exunt, we have include the quarterend operating lase verile count in the table above. Somc legacy cases require lease accounting, despite recciving cash associated with the full vchicle price at time of delivery. As those leases eexpire and the return caption is not taken the remaining unrecognized revenue and COGS are txoked to leasing revenue and lessing COGS Dayscy calculated by Cincarchengimatory by the waters SSV W Combine Files Creale, edit and sign PDF forms & agreements Sarl Free Trial Type here to search oc ENG 10:28 AM CMS 1/20/2020 14 0220 Update.pdf - Adobu Marubial Meather DC File Edit View Sign Window Helio Home Tools Q220 Update.pdf X Sign In 50.19 e Search 'Insert Page D. Export PDF Adobe Export PDF Convert PDF Files to Word or Excel Online QOQ FINANCIAL SUMMARY (Unaudited) ($ in millions, except percentages and per share data) Automotive TV of which regulatory credits Automotive gross profit Automotive gross margin 19 Q2 2019 03 2019 Q4 2019 QL 2020 Q2 2020 5,376 5.353 6,36A 5,132 5,179 111 134 133 354 428 1,016 1.222 1.131 1.311 1.317 18.9% 22.8% 22.5% 25.5% 25.4% YOY -4% 286% 30% 653 bp 21% 0% -12 bp Select PDF File Q220 Update.pdf X Convert to Total revenues Total gres porci Total GAAP gross margin 6,350 921 6.303 1,191 18.99 7,384 1,391 18 8% 5,985 1,234 20.6% 6,036 1,267 21.0% 1% 39 37 bp 5% 39% 649 bp Microsoft Word (.docx) 930 Document Language English (U.S. Change Operating expenses (Loss) income from operations Operating margin 1.088 (167) -2.6% 261 1.1% 1032 359 1.9% 951 283 1.7% 327 5.1% -7% 16% 69 bp -14% N/A 805 bp 572 Adjusted EBITDA Adjusted FBITDA margin 1003 17.24 1.175 15.9% Convert 951 15.9 1,209 20.0% 27% 414 In 111% % 1,102 bp 550% % Nct (loss) income attributablc to common stockholders (GAAP) Net (loss) income attributable to common stockholders (non-GAAP) (108) (198) 143 342 105 386 16 22/ 101 151 N/A N/A Edit PDF EPS attributable to common stockholders, diluted (GAP) FPS attributable to common stockholders, diluted (non-GAAP) (2.31) (1.12) 0.78 LAG 0.56 2.06 0.00 1.14 0.50 2.18 525 9196 N/A N/A L. Create PDF = Comment Nct cash provided by (used in) operating activitics Capital expenditures Free cash flow Cash and cash equivalents 861 (250) 614 4.955 756 (385) 371 5,333 1.425 (412) 1,013 6,268 (110) (455) (895) 8,080 961 1516) 418 0,615 NA 20% N/A 7% 12% 118% -32% 74% W Combine Files EPS - Earrings Der Star Creale, edit and sign PDF forms & agreements Sarl Free Trial Type here to search oc ** ENG 10:27 AM CMS 1/20/2020 13Step by Step Solution
There are 3 Steps involved in it
Step: 1

Get Instant Access to Expert-Tailored Solutions
See step-by-step solutions with expert insights and AI powered tools for academic success
Step: 2

Step: 3
Ace Your Homework with AI
Get the answers you need in no time with our AI-driven, step-by-step assistance
Get Started
Intermediate Accounting
Authors: Donald E. Kieso, Jerry J. Weygandt, And Terry D. Warfield
13th Edition
9780470374948, 470423684, 470374942, 978-0470423684