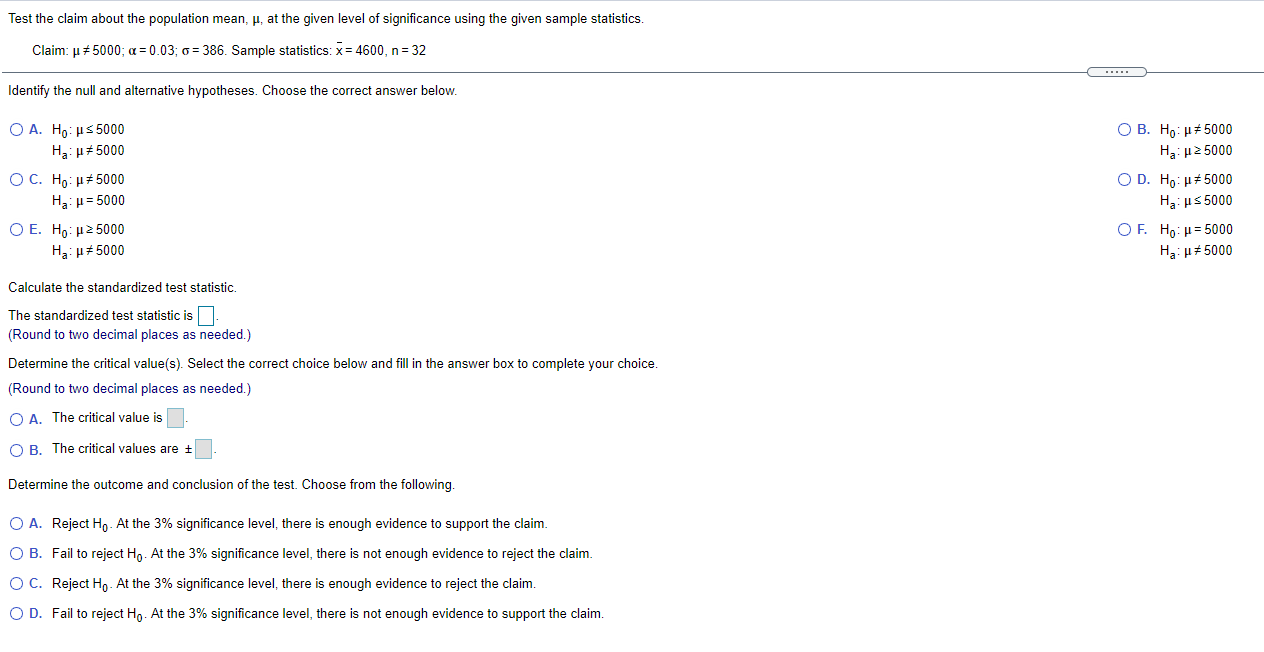
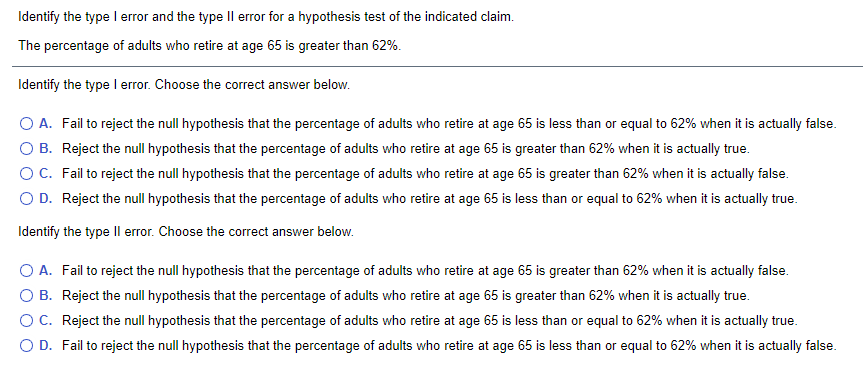
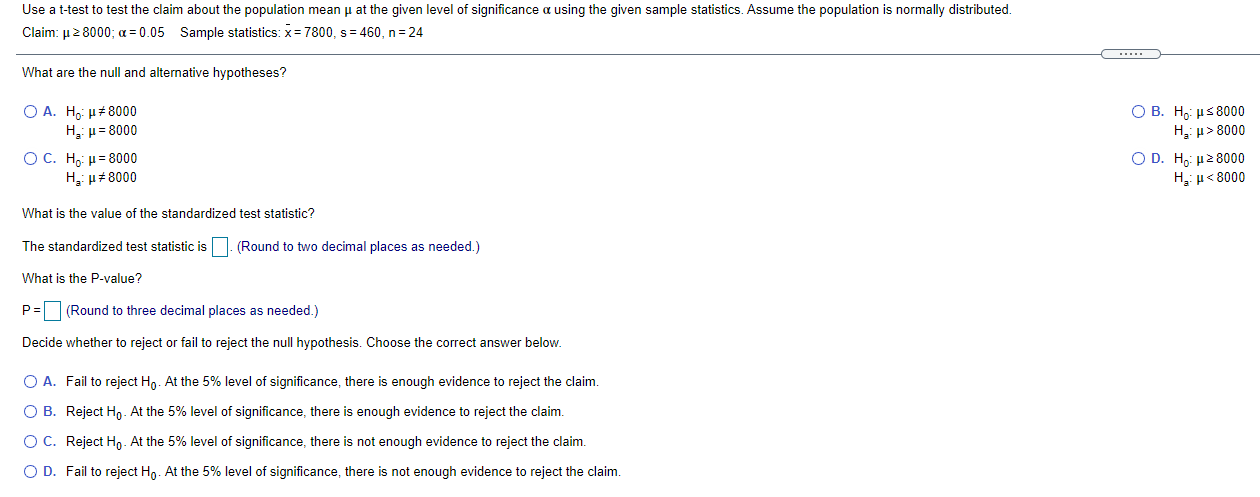
Test the claim about the population mean, , at the given level of significance using the given sample statistics. Claim: p #5000; 5000 O C. Ho: H # 5000 O D. Ho: H # 5000 Ha: H = 5000 Ha: H $ 5000 O E. Ho: H 2 5000 OF. Ho: H = 5000 Ha: H # 5000 Ha : H # 5000 Calculate the standardized test statistic. The standardized test statistic is(]. (Round to two decimal places as needed.) Determine the critical value(s). Select the correct choice below and fill in the answer box to complete your choice. (Round to two decimal places as needed.) O A. The critical value is. O B. The critical values are + Determine the outcome and conclusion of the test. Choose from the following. O A. Reject Ho- At the 3% significance level, there is enough evidence to support the claim. O B. Fail to reject Ho. At the 3% significance level, there is not enough evidence to reject the claim. O C. Reject Ho- At the 3% significance level, there is enough evidence to reject the claim. O D. Fail to reject Ho. At the 3% significance level, there is not enough evidence to support the claim.Identify the type I error and the type II error for a hypothesis test of the indicated claim. The percentage of adults who retire at age 65 is greater than 62%. Identify the type I error. lIChoose the correct answer below. DA. DE. DC. OD. Fail to reject the null hypothesis that the percentage of adults who retire at age 65 is less than or equal to 62% when it is actually false. Reject the null hypothesis that the percentage of adults who retire at age 66 is greater than 62% when it is actually true. Fail to reject the null hypothesis that the percentage of adults who retire at age 65 is greater than 62% when it is actually false. Reject the null hypothesis that the percentage of adults who retire at age 66 is less than or equal to 62% when it is actually true. Identify the type II error. Choose the correct answer below. DA. DE. DC. OD. Fail to reject the null hypothesis that the percentage of adults who retire at age 65 is greater than 62% when it is actually false. Reject the null hypothesis that the percentage of adults who retire at age 66 is greater than 62% when it is actually true. Reject the null hypothesis that the percentage of adults who retire at age 66 is less than or equal to 62% when it is actually true. Fail to reject the null hypothesis that the percentage of adults who retire at age 65 is less than or equal to 62% when it is actually false. Use a t-test to test the claim about the population mean u at the given level of significance a using the given sample statistics. Assume the population is normally distributed. Claim: p 2 8000; a = 0.05 Sample statistics: x = 7800, s = 460, n = 24 What are the null and alternative hypotheses? O A. Ho: H # 8000 O B. Ho: HIS 8000 Ha: H= 8000 HE: H > 8000 O C. Ho: H = 8000 O D. Ho: H 2 8000 HE: H # 8000 Ha: H