Testable Question: How does current depend on the voltage and resistance of devices in an electric circuit? Use this Phet to change the variables to
Testable Question: How does current depend on the voltage and resistance of devices in an electric circuit? Use this Phet to change the variables to determine the effects of voltage and resistance in BOTH a series and a parallel circuit. Phet - Circuit Construction Virtual Lab Experiment 1: How does current depend on increasing voltage in a series circuit (begin with 1.5 V)? Experiment 2: How does current depend on increasing resistance in a series circuit? Experiment 3: How does current depend on increasing voltage in a parallel circuit (begin with 1.5 V)? Experiment 4: How does current depend on increasing resistance in a parallel circuit? How do I find the data for the table of observations for this lab report?
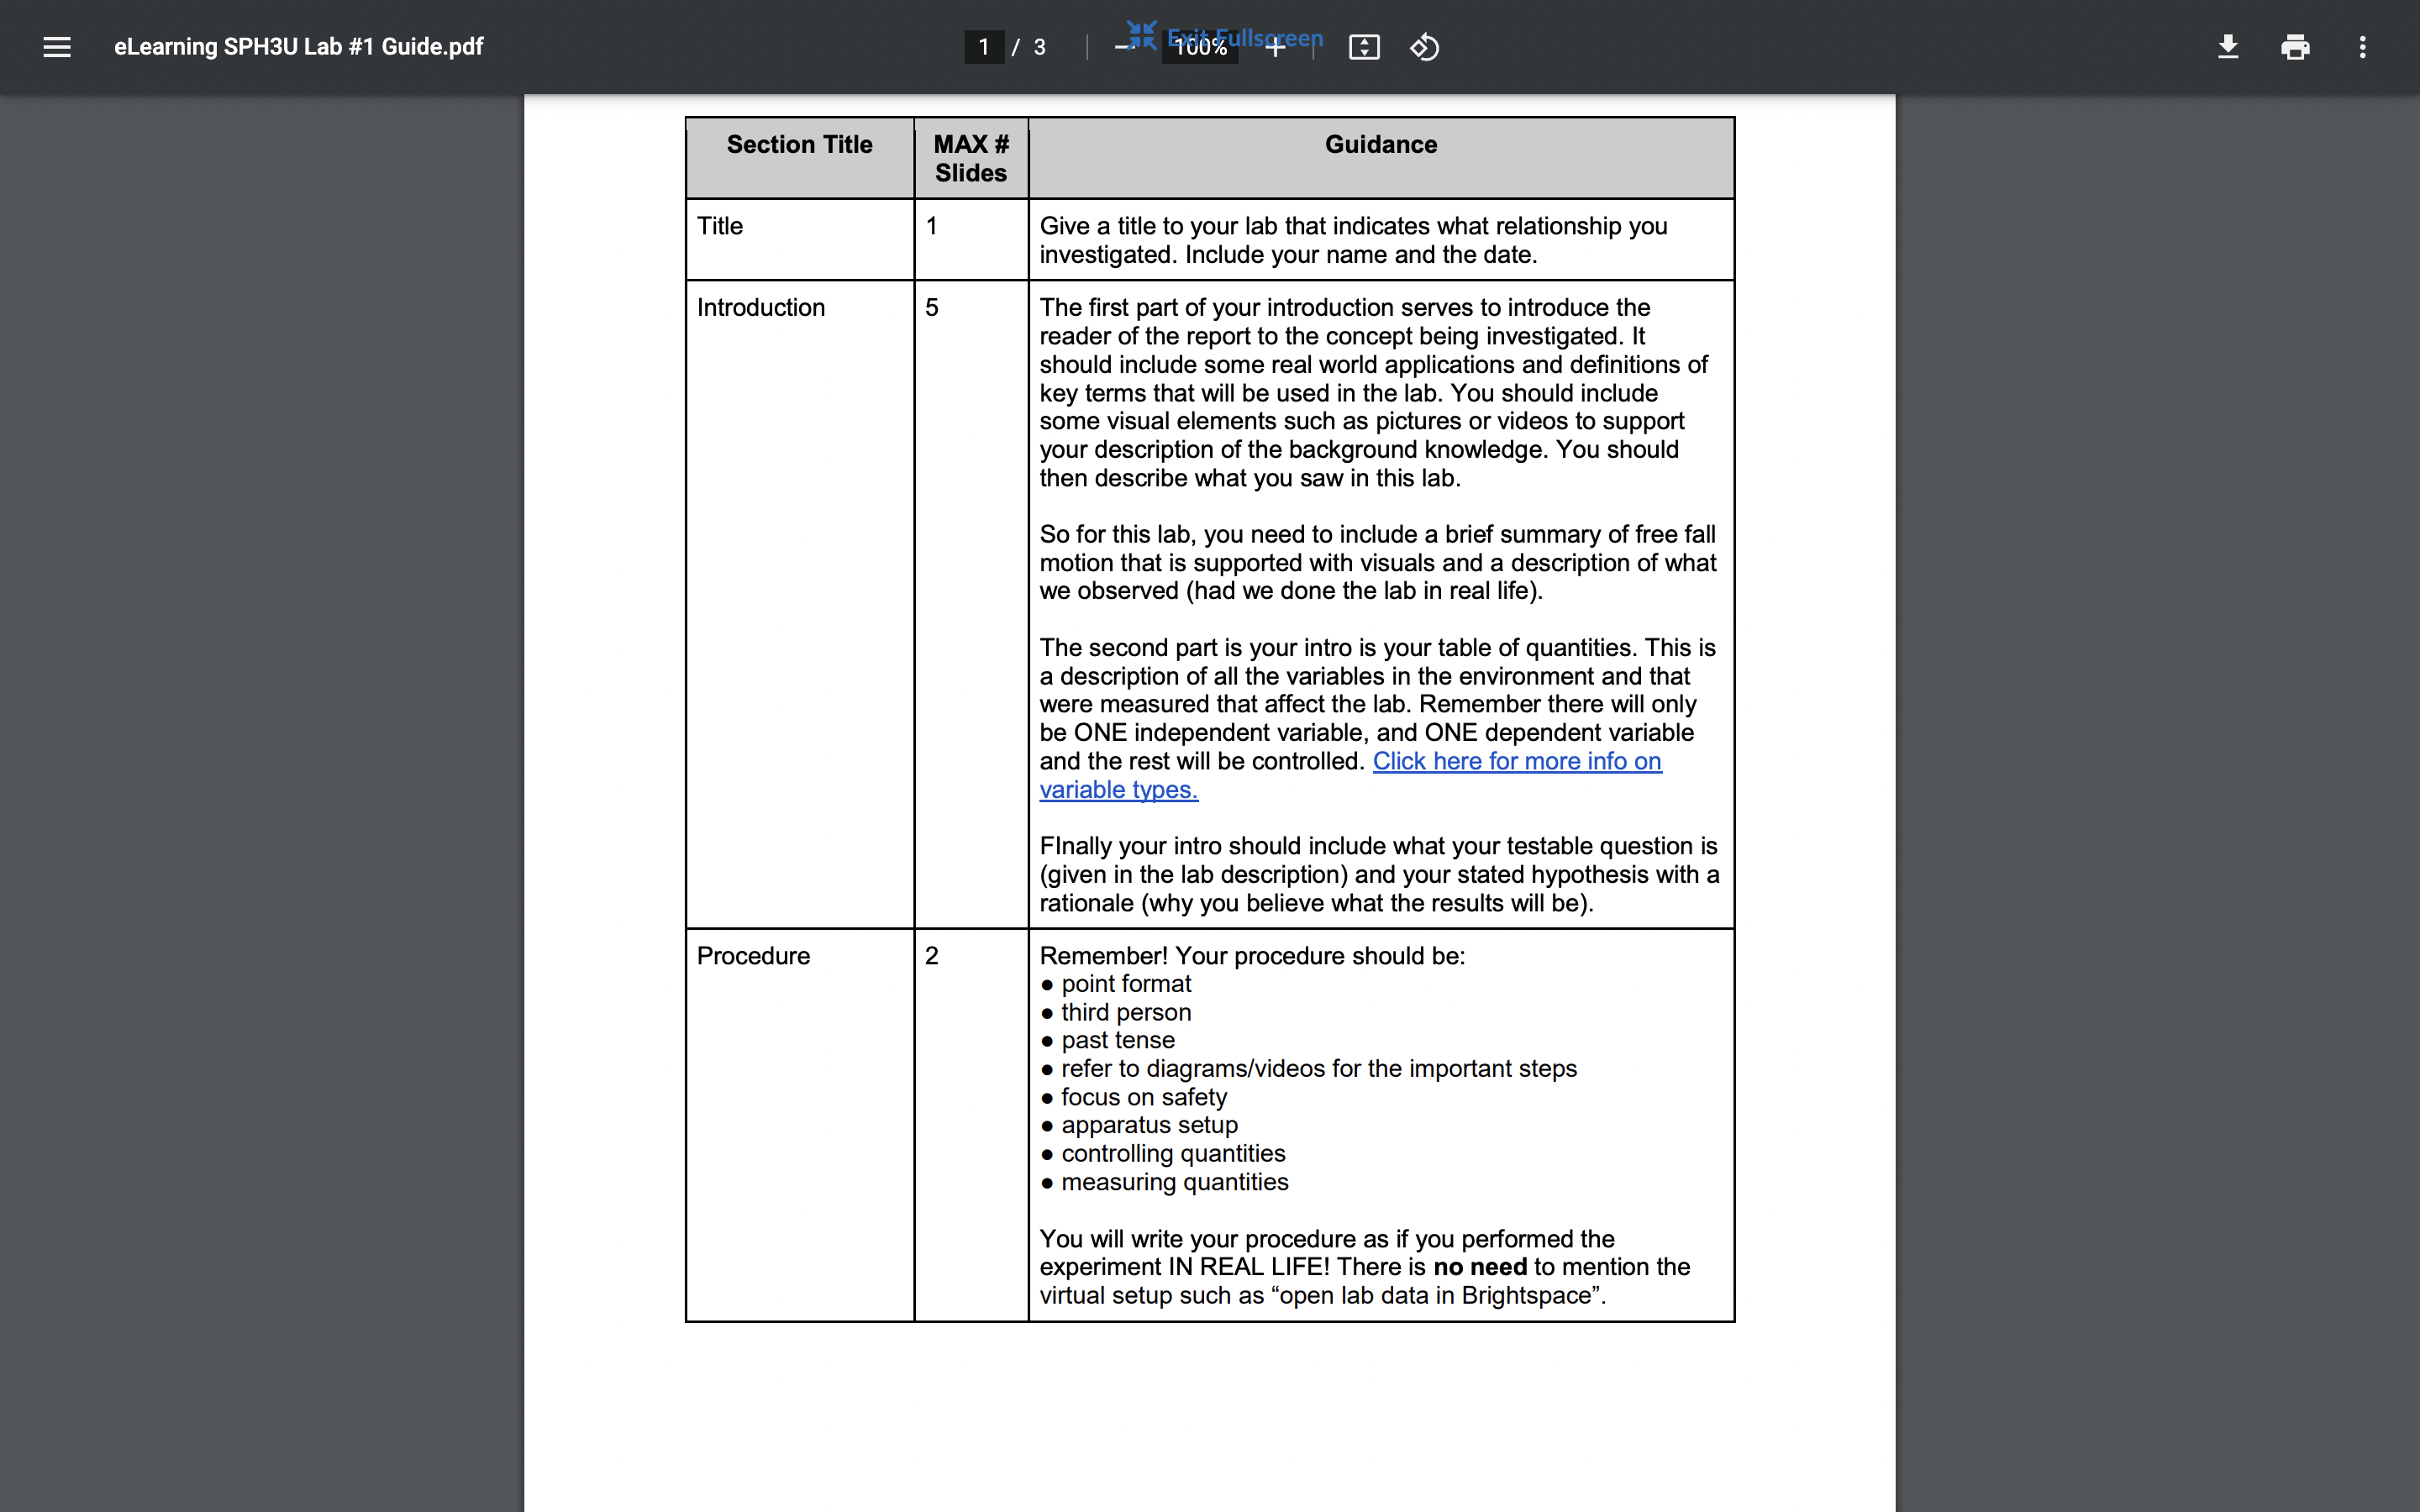
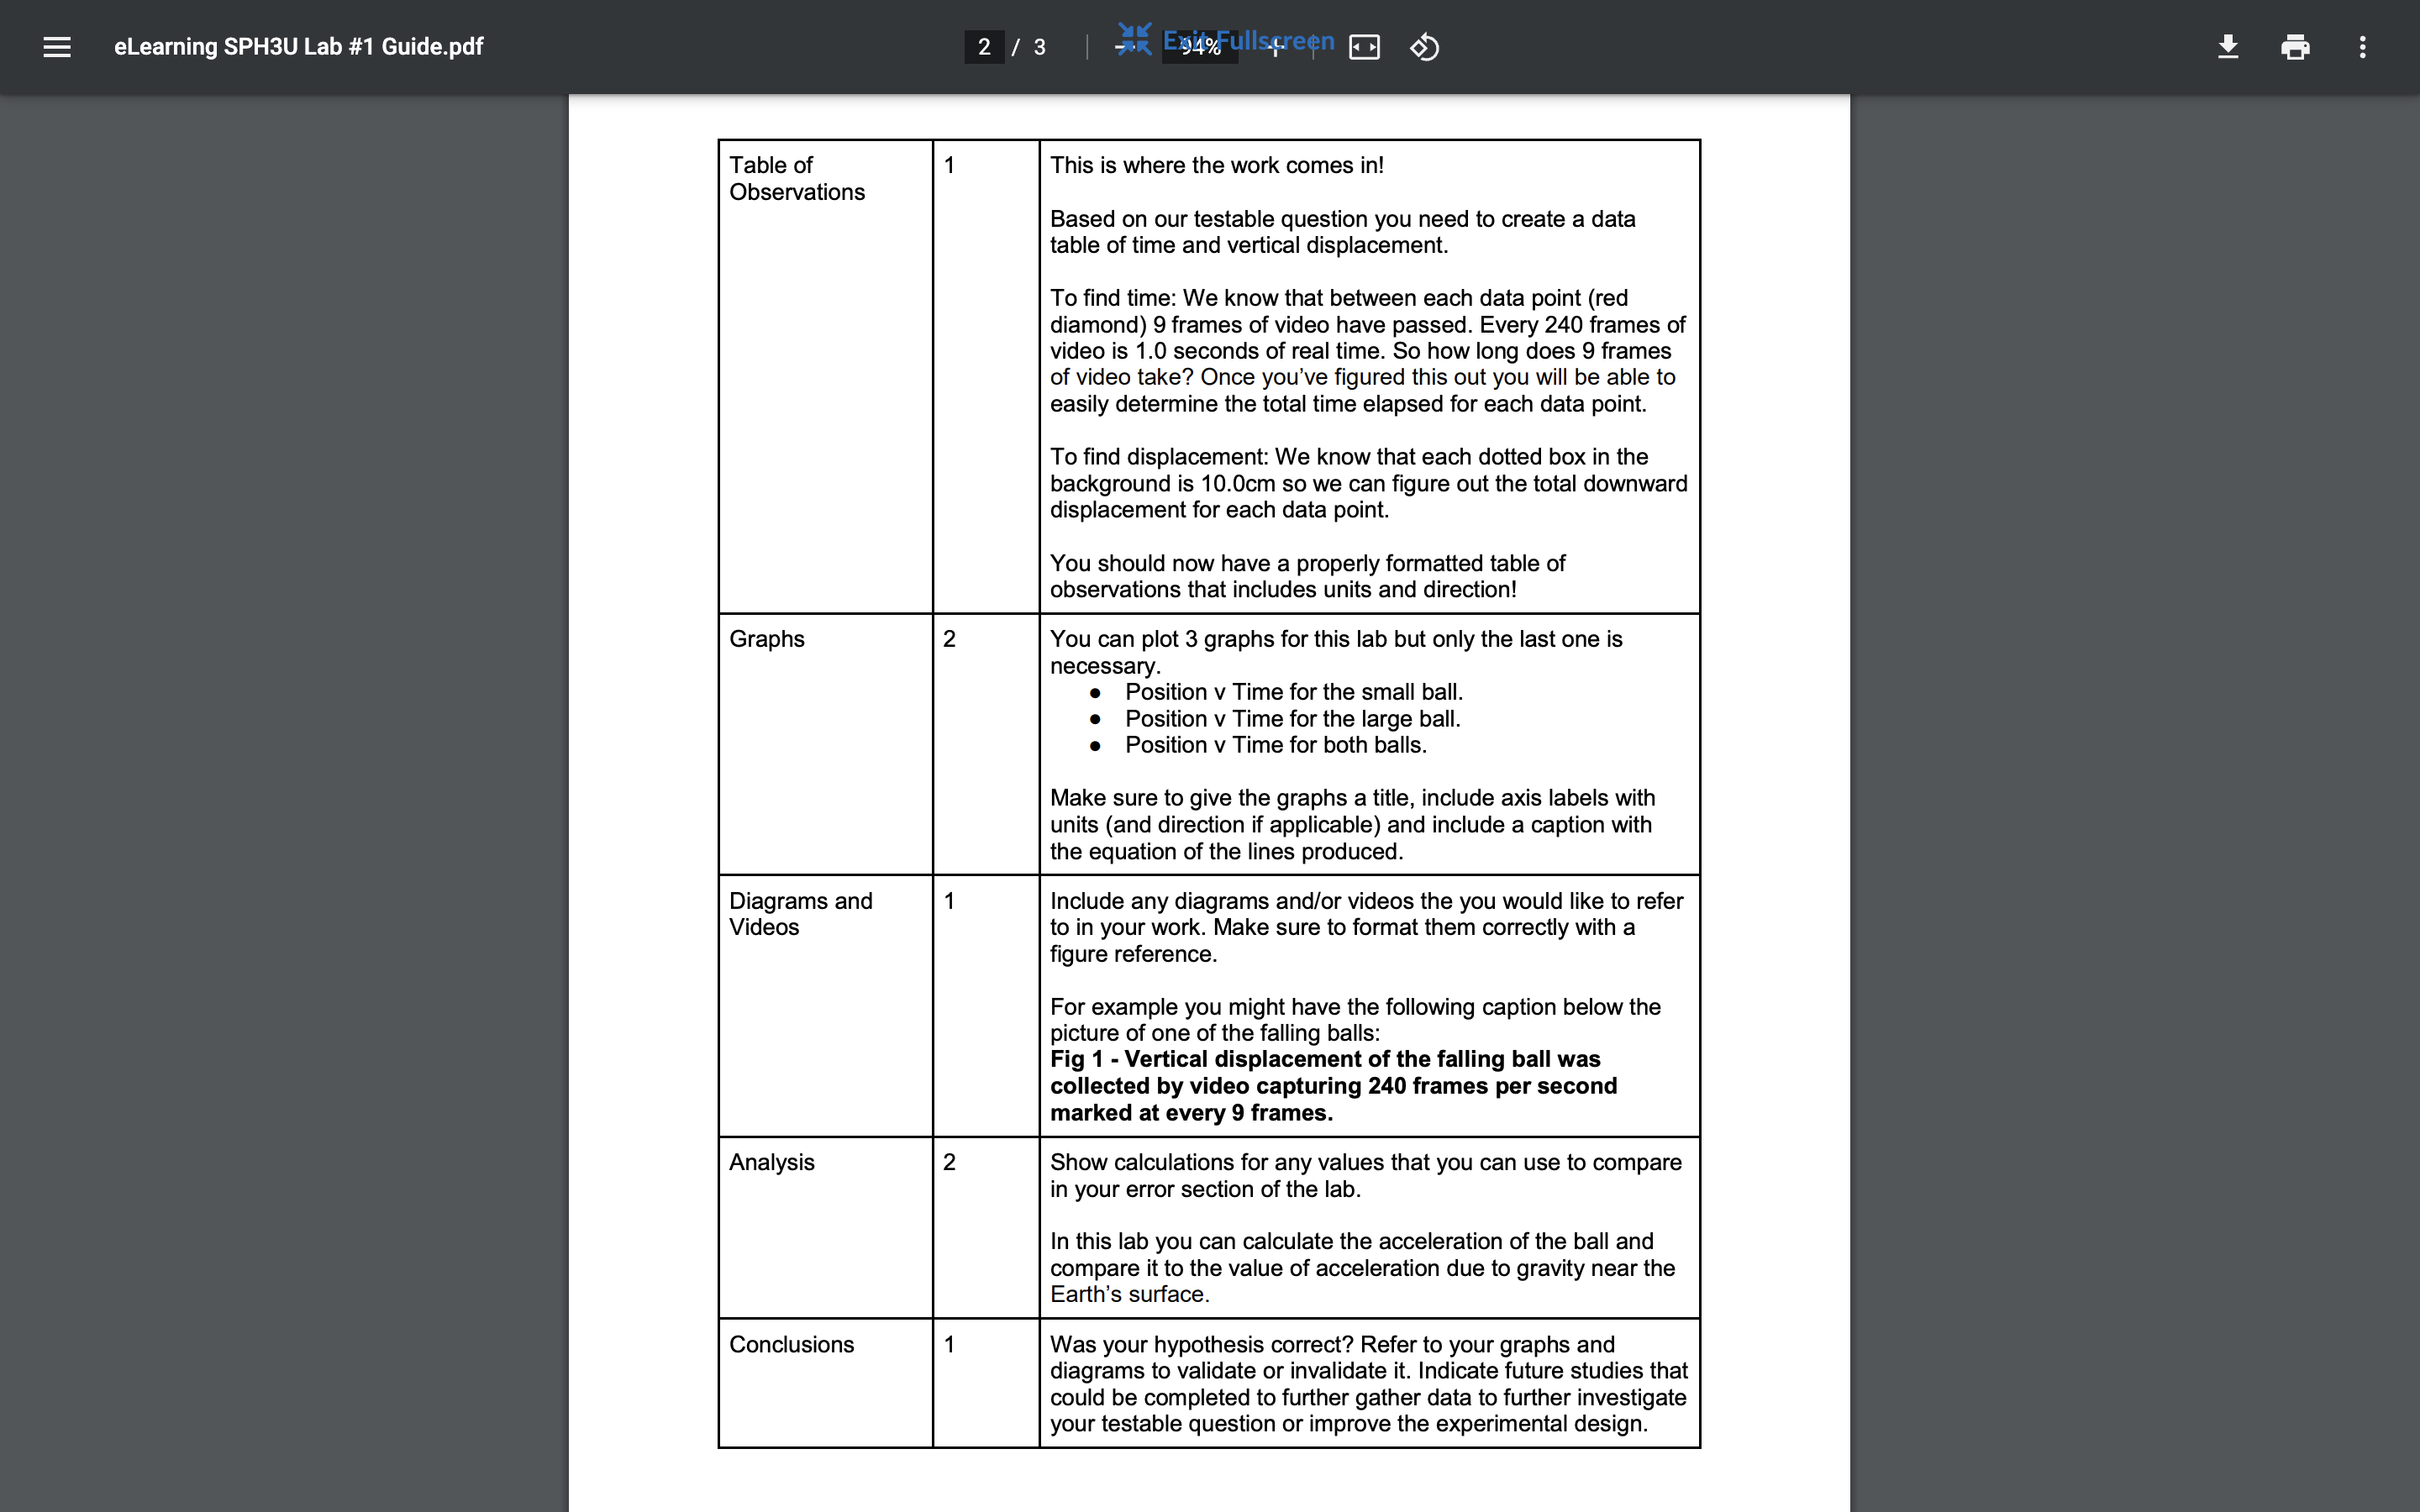
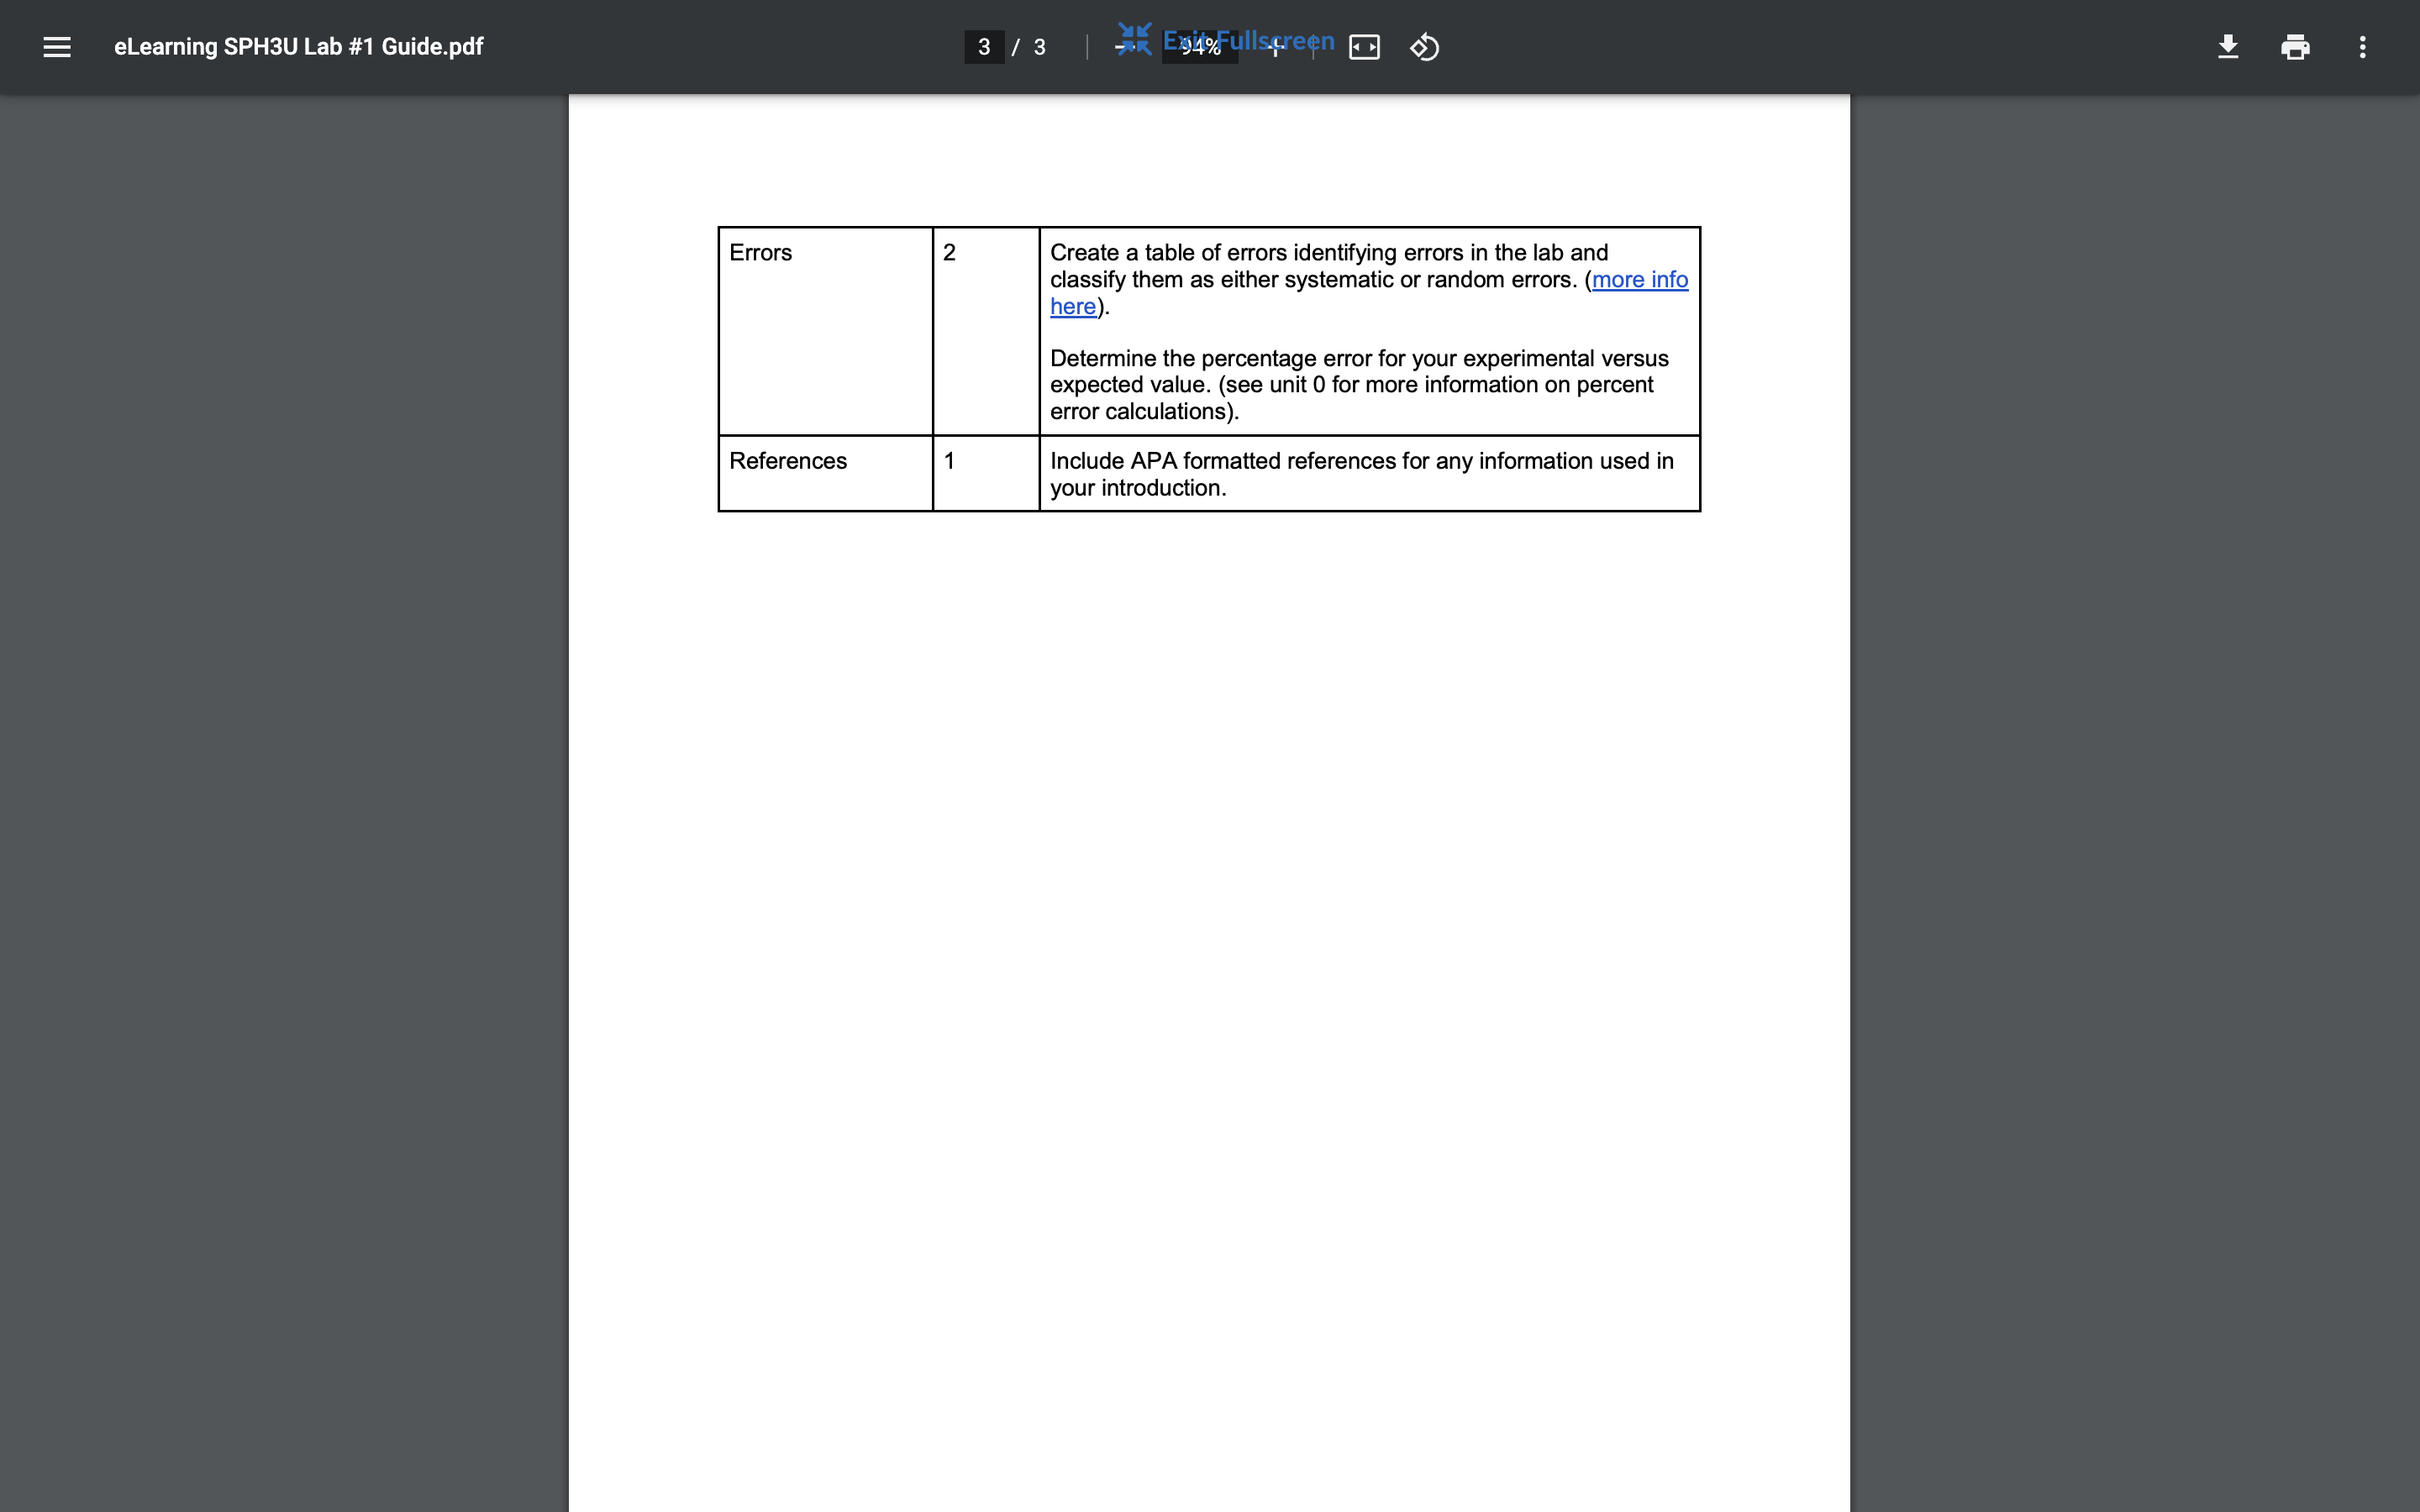
E eLearning SPH3U Lab #1 Guidepdf Section Tl'tlo Give a title to your lab that indicates \\M'rat relationship you investigated. Include your name and the date. Introduction The rst part of your introduction serves to introduce the reader of the report to the concept being investigated. It should include some real world applications and denitions of key terms that will be used in the lab. You should include some visual elements such as pictures or videos to support your description of the background knowledge. You should then describe what you saw in this lab. So for this lab, you need to include a brief summary of free fall motion that is supported with visuals and a description of what we observed (had we done the lab in real life). The second part is your intro is your mble of quanties. This is a description of all the variables in the environment and that were measured that affect the lab. Remember there will only be ONE independent variable, and ONE dependent variable and the rest will be controlled. Click here for more info on variable types. Finally your intro should include what your testable question is (given in the lab description) and your stated hypothesis with a rationale (why you believe what the results will be). Procedure Remember! Your procedure should be: I point format 0 third person 0 past tense 0 refer to diagrams/videos for the important steps 0 focus on safety 0 apparatus setup 0 controlling quantities o measuring quantities You will write your procedure as if you performed the experiment IN REAL LIFE! There is no need to mention the virtual setup such as "open lab data in Brightspace". eLearning SPH3U Lab #1 Guidepdf Table of Observations Diagrams and Videos Analysis Conclusions This is where the work comes in! Based on our testable question you need to create a data table of time and vertical displacement. To nd time: We know that between each data point (red diamond) 9 frames of video have passed. Every 240 frames of video is 1.0 seconds of real time. So how long does 9 frames of video take? Once you've gured this out you will be able to easily determine the total time elapsed for each data point. To nd displacement: We know that each dotted box in the background is 10.0cm so we can gure out the total downward displacement for each data point. You should now have a properly formatted table of observations that includes units and direction! You can plot 3 graphs for this lab but only the last one is necessary. 0 Position v Time for the small ball. 0 Position v Time for the large ball. . Position v Time for both balls. Make sure to give the graphs a title, include axis labels with units (and direction if applicable) and include a caption with the equation of the lines produced. Include any diagrams and/or videos the you would like to refer to in your work. Make sure to format them correctly with a gure reference. For example you might have the following caption below the picture of one of the falling balls: Fig 1 - Vertical displacement of the falling ball was collected by video capturing 240 frames per second marked at every 9 frames. Show calculations for any values that you can use to compare in your error section of the lab. In this lab you can calculate the acceleration of the ball and compare it to the value of acceleration due to gravity near the Earth's surface Was your hypothesis correct? Refer to your graphs and diagrams to validate or invalidate it. Indicate future studies that could be completed to further gather data to further investigate your testable question or improve the experimental design. eLearning SPH3U Lab #1 Guidepdf Create a table of errors identifying errors in the lab and classify them as either systematic or random errors. (more info here). Determine the percentage error for your experimental versus expected value. (see unit 0 for more information on percent error calculations). References Include APA formatted references for any information used in your introduction
Step by Step Solution
There are 3 Steps involved in it
Step: 1
Get Instant Access to Expert-Tailored Solutions
See step-by-step solutions with expert insights and AI powered tools for academic success
Step: 2
Step: 3
Ace Your Homework with AI
Get the answers you need in no time with our AI-driven, step-by-step assistance