Answered step by step
Verified Expert Solution
Link Copied!

Question

1 Approved Answer

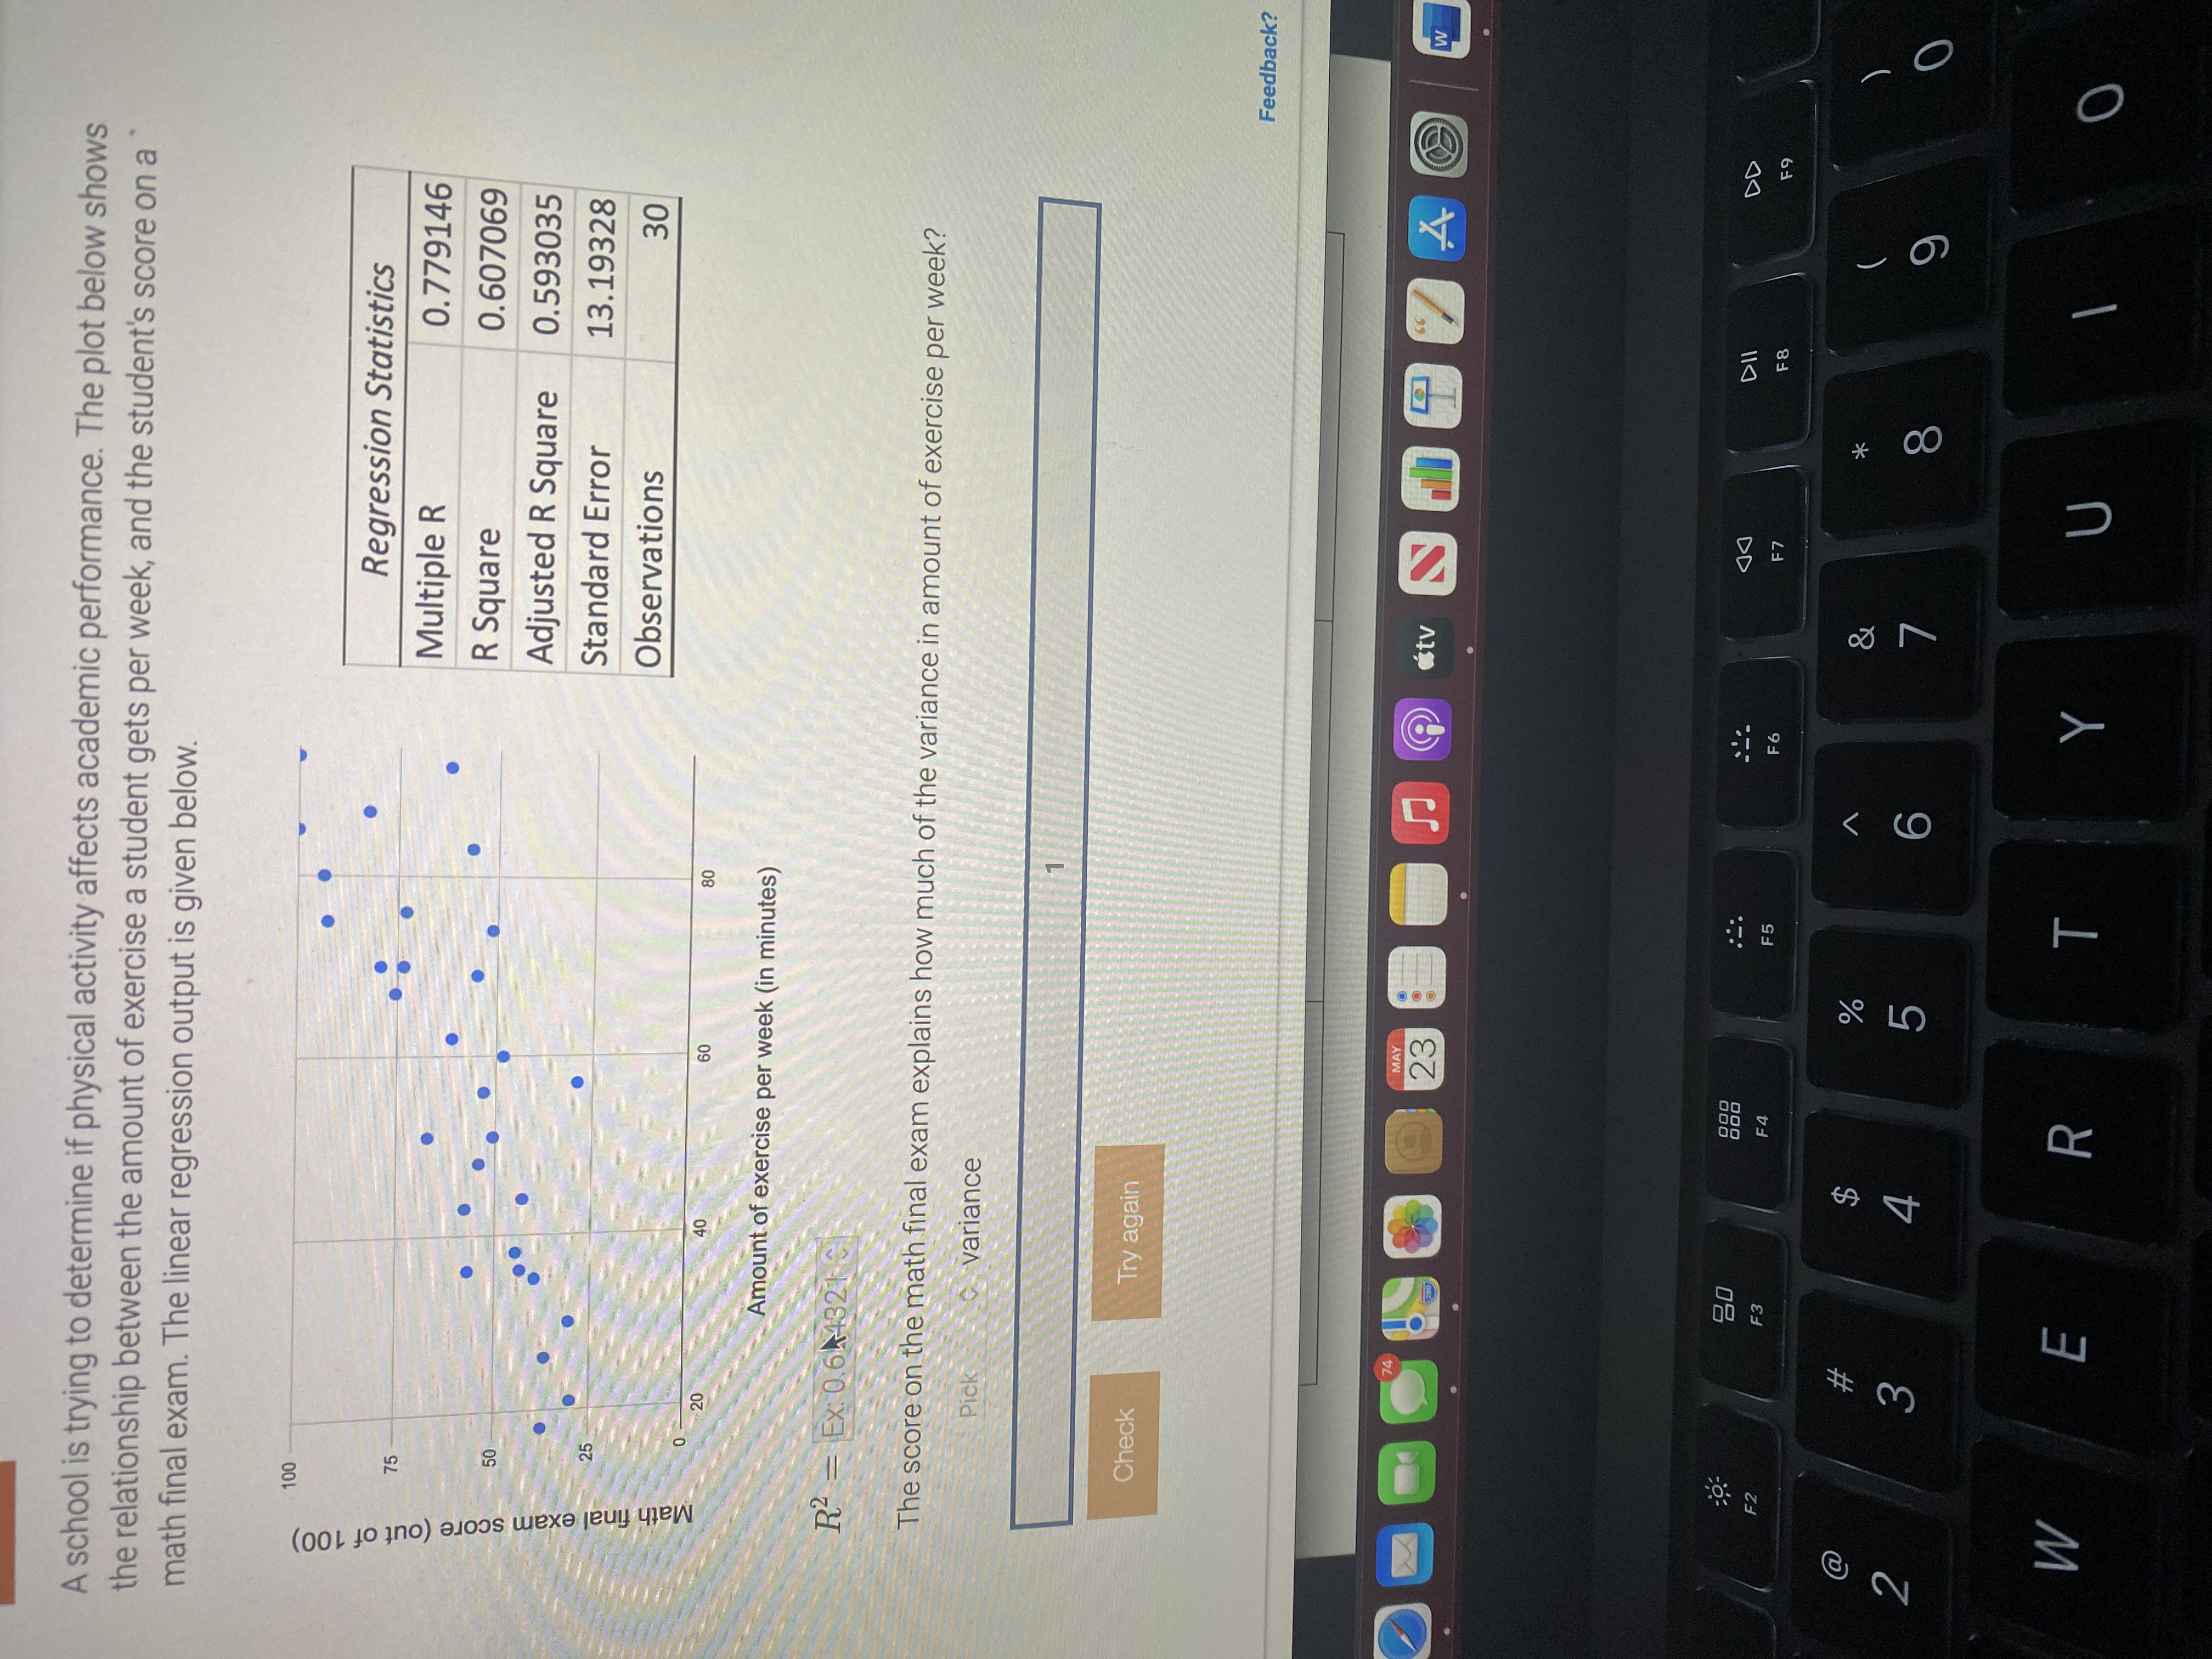
Thank you so much for the help! A school is trying to determine if physical activity affects academic performance. The plot below shows the relationship

Thank you so much for the help!

image text in transcribed
A school is trying to determine if physical activity affects academic performance. The plot below shows the relationship between the amount of exercise a student gets per week, and the student's score on a math final exam. The linear regression output is given below. 100 Regression Statistics 75 Multiple R 0.779146 R Square 0.607069 Math final exam score (out of 100) Adjusted R Square 0.593035 25 Standard Error 13.19328 Observations 30 20 40 60 80 Amount of exercise per week (in minutes) R2 = Ex: 0.644321 The score on the math final exam explains how much of the variance in amount of exercise per week? Pick variance Check Try again Feedback? MAY 23 *tv 4 W DII F3 F4 F5 F6 E7 F 8 @ $ % 2 4 5 6 O W E R T Y U O

Step by Step Solution

There are 3 Steps involved in it

Step: 1

blur-text-image

Get Instant Access to Expert-Tailored Solutions

See step-by-step solutions with expert insights and AI powered tools for academic success

Step: 2

blur-text-image

Step: 3

blur-text-image

Ace Your Homework with AI

Get the answers you need in no time with our AI-driven, step-by-step assistance

Get Started

Recommended Textbook for

More Books

Students also viewed these Mathematics questions