Answered step by step
Verified Expert Solution
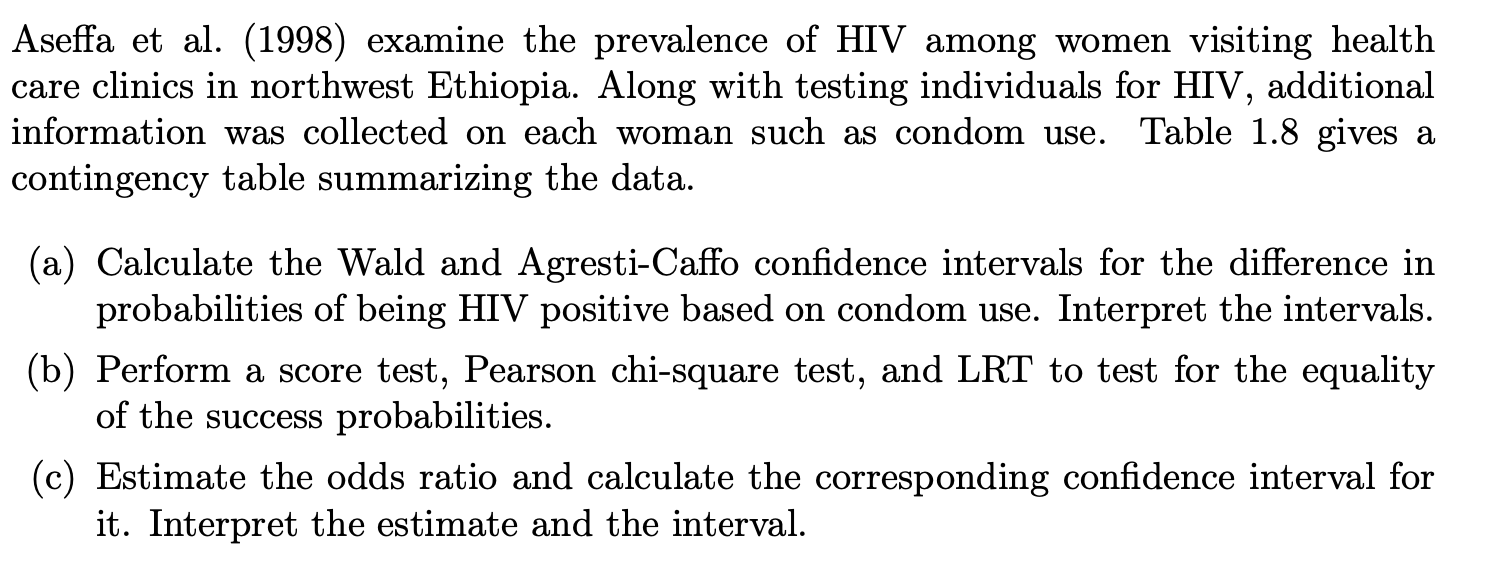
Link Copied!

Question

1 Approved Answer

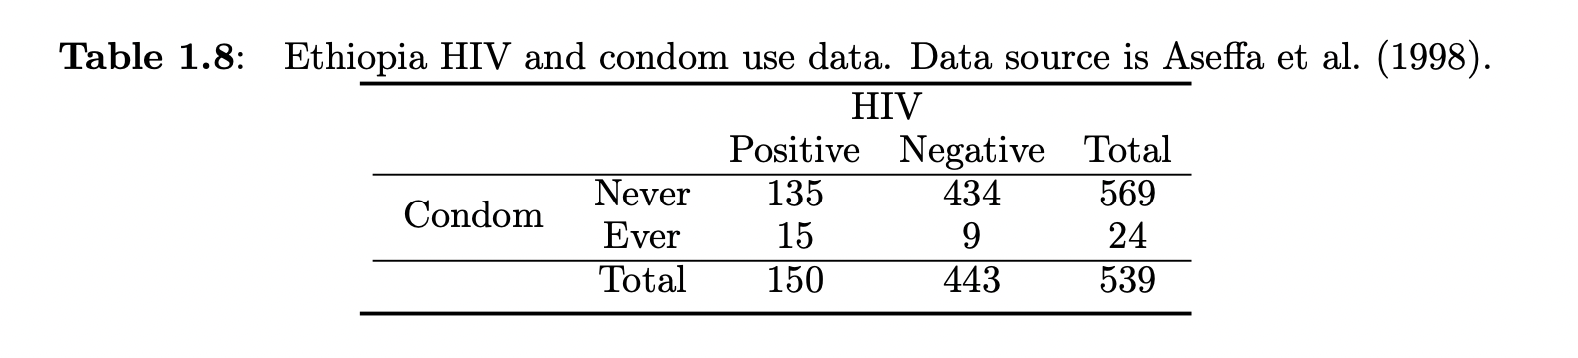
thank you! this was all I was given Table 1.8: Ethiopia HIV and condom use data. Data source is Aseffa et al. (1998). HIV Positive

thank you! this was all I was given

image text in transcribedimage text in transcribed
Table 1.8: Ethiopia HIV and condom use data. Data source is Aseffa et al. (1998). HIV Positive Negative Total Never 135 434 569 Condom Ever 15 9 24 Total 150 443 539Aseffa et al. (1998) examine the prevalence of HIV among women visiting health care clinics in northwest Ethiopia. Along with testing individuals for HIV, additional information was collected on each woman such as condom use. Table 1.8 gives a contingency table summarizing the data. (a) Calculate the Wald and Agresti-Caffo confidence intervals for the difference in probabilities of being HIV positive based on condom use. Interpret the intervals. (b) Perform a score test, Pearson chi-square test, and LRT to test for the equality of the success probabilities. (c) Estimate the odds ratio and calculate the corresponding confidence interval for it. Interpret the estimate and the interval

Step by Step Solution

There are 3 Steps involved in it

Step: 1

blur-text-image

Get Instant Access to Expert-Tailored Solutions

See step-by-step solutions with expert insights and AI powered tools for academic success

Step: 2

blur-text-image

Step: 3

blur-text-image

Ace Your Homework with AI

Get the answers you need in no time with our AI-driven, step-by-step assistance

Get Started

Recommended Textbook for

Linear Algebra With Applications

Authors: Gareth Williams, Williams

9th Edition

1284120104, 9781284120103

More Books

Students also viewed these Mathematics questions

Question

-7 dy 2 Find fory = (2x-3) dx dy dx =

Answered: 1 week ago