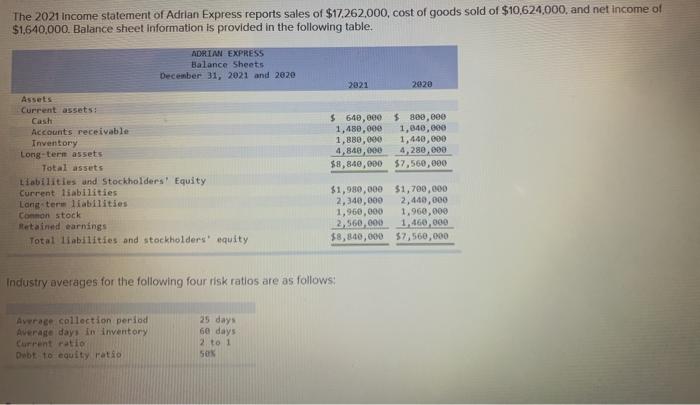
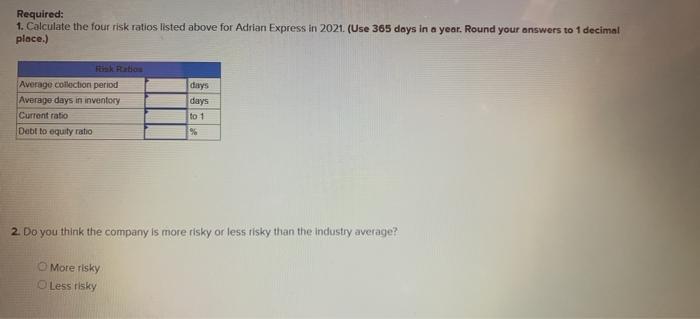
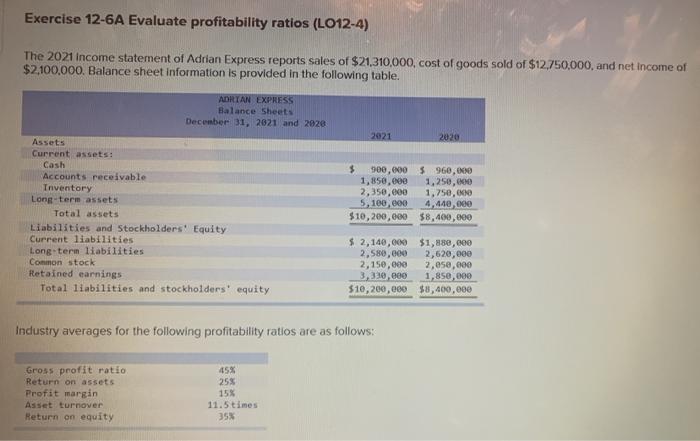
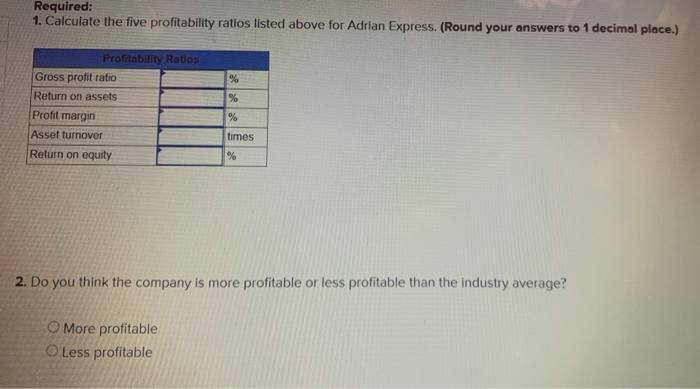
The 2021 Income statement of Adrian Express reports sales of $17,262,000, cost of goods sold of $10,624.000, and net income of $1,640,000. Balance sheet Information is provided in the following table. ADRIAN EXPRESS Balance Sheets December 31, 2021 and 2020 2821 2020 $ 640,000 $800,000 1,480,000 1,040,000 1,880,000 1,440,000 4,840,000 4,280,000 $8,840,000 $7,560,000 Assets Current assets: Casti Accounts receivable Inventory Long-term assets Total assets Liabilities and Stockholders' Equity Current liabilities Long-term liabilities Common stock Retained earnings Total liabilities and stockholders' equity $1,980,000 $1,700,000 2,340,000 2,400,000 1,960,000 1,960,000 2,560,000 1,460,000 $8,800,000 $7,560,000 Industry averages for the following four risk ratios are as follows: Average collection period Average days in inventory Current ratio Debt to equity ratio 60 days 2. to 1 SOK Required: 1. Calculate the four risk ratios listed above for Adrian Express in 2021. (Use 365 days in a year. Round your answers to 1 decimal place.) tik Ratio Average collection period Average days in inventory Current ratio Debt to equity ratio days days % Do you think the company is more risky or less risky than the industry average? More risky Less risky Exercise 12-6A Evaluate profitability ratios (L012-4) The 2021 income statement of Adrian Express reports sales of $21,310,000, cost of goods sold of $12,750,000, and net income of $2,100,000. Balance sheet information is provided in the following table. ADRIAN EXPRESS Balance Sheets December 31, 2021 and 2028 2021 2020 Assets Current assets: Cash Accounts receivable Inventory Long-term assets Total assets Liabilities and Stockholders' Equity Current liabilities Long term liabilities Common stock Retained earnings Total liabilities and stockholders' equity 5 900,000 $ 960, 1,850,000 1,250,00 2,350,00 1,750,00 5,100,000 4.440,000 $10,200,000 $8,400,000 $ 2,140,000 $1,880,000 2,580,000 2,620,000 2,150,000 2,050,000 3,330,000 1,850,000 $10,200,000 $8,400,000 Industry averages for the following profitability ratios are as follows: Gross profit ratio Return on assets Profit margin Asset turnover Return on equity 45% 25% 15% 11.5 times 35% Required: 1. Calculate the five profitability ratios listed above for Adrian Express. (Round your answers to 1 decimal place.) % % Profitability Ratios Gross profit ratio Return on assets Profit margin Assel turnover Return on equity % times % 2. Do you think the company is more profitable or less profitable than the industry average? More profitable Less profitable