Answered step by step
Verified Expert Solution
Question
1 Approved Answer
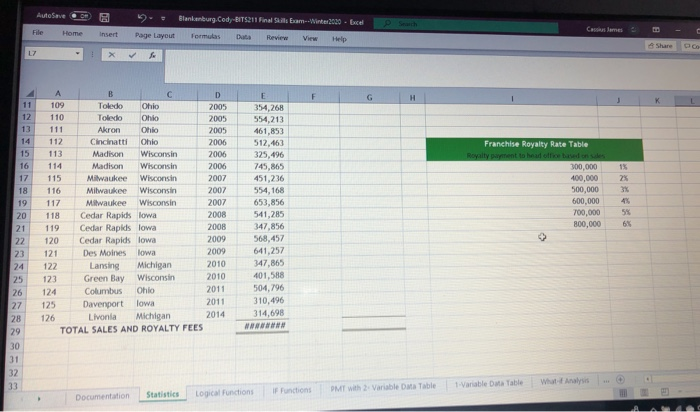
The 3rd photo is just a continuing the same worksheet ent Paragraph Styles Documentation Fill in your name, class and date on the Documentation sheet.


The 3rd photo is just a continuing the same worksheet
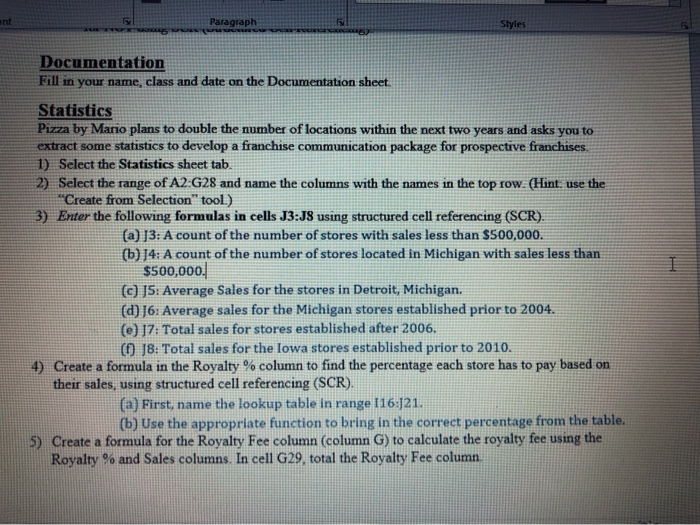
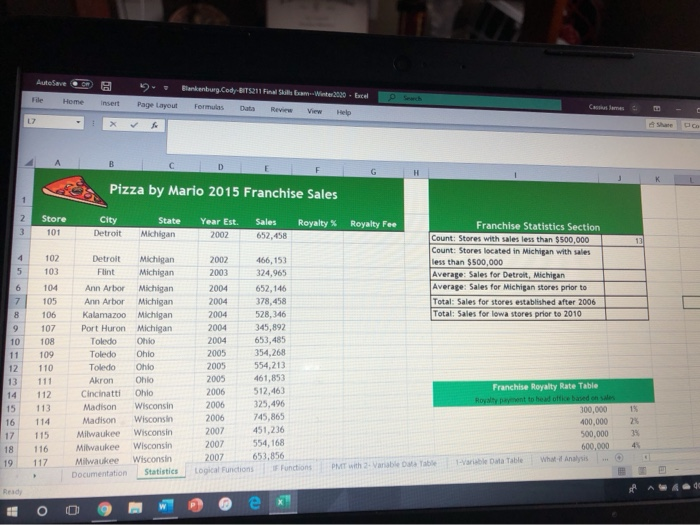
ent Paragraph Styles Documentation Fill in your name, class and date on the Documentation sheet. Statistics Pizza by Mario plans to double the number of locations within the next two years and asks you to extract some statistics to develop a franchise communication package for prospective franchises. 1) Select the Statistics sheet tab. 2) Select the range of A2:628 and name the columns with the names in the top row. (Hint, use the "Create from Selection tool.) 3) Enter the following formulas in cells J3:J8 using structured cell referencing (SCR). (a) J3: A count of the number of stores with sales less than $500,000. (b) J4: A count of the number of stores located in Michigan with sales less than $500,000 (c) J5: Average Sales for the stores in Detroit, Michigan. (d) J6: Average sales for the Michigan stores established prior to 2004. (e) 17: Total sales for stores established after 2006. (1) J8: Total sales for the Iowa stores established prior to 2010. 4) Create a formula in the Royalty % column to find the percentage each store has to pay based on their sales, using structured cell referencing (SCR). (a) First, name the lookup table in range 116:J21. (b) Use the appropriate function to bring in the correct percentage from the table. 5) Create a formula for the Royalty Fee column (column G) to calculate the royalty fee using the Royalty % and Sales columns. In cell G29. total the Royalty Fee column AutoSave D File Home u Insert rg. Cod ets2 Fra Formulas Data Review Page Layout 2000. Bad Help View Pizza by Mario 2015 Franchise Sales Store 101 City Detroit State Michigan Year Est. 2002 Sales 652,458 Royalty % Royalty Fee 102 103 Franchise Statistics Section Count: Stores with sales less than $500,000 Count: Stores located in Michigan with sales less than $500.000 Average: Sales for Detroit, Michigan Average: Sales for Michigan stores prior to Total: Sales for stores established after 2006 Total: Sales for lowa stores prior to 2010 104 105 106 107 108 109 Ohio Detroit Michigan Flint Michigan Ann Arbor Michigan Ann Arbor Michigan Kalamazoo Michigan Port Huron Michigan Toledo Ohio Toledo Toledo Ohio Akron Ohio Cincinatti Ohio Madison Wisconsin Madison Wisconsin Milwaukee Wisconsin Milwaukee Wisconsin Milwaukee Wisconsin Documentation Statistics 2002 466,153 2003 324,965 2004 652,146 2004 378,458 2004 528,346 2004 345,892 2004 653,485 2005 354,268 2005 554,213 2005 461,853 2006 512,463 2006 325,496 2006 745,865 2007 451,236 2007 554, 168 2007 653,856 topical Functions Functions 111 112 113 114 115 116 117 Franchise Royalty Rate Table - Royalty pavement to host office based on allen 300,000 400,000 500,000 600,000 Table Data Table What Analysis . 15 23 3% 45 17 18 19 PMT with 2 Variable Table Rady P S AutoSave File Home " . Page Layout Blankenburg.Cod-BITS211 Final Sun Bam-- w Formulas Review View 2000 - Excel Help insert F Franchise Royalty Rate Table 13 14 15 16 17 15 Toledo Ohio 2005 Tonto Ohio 2005 111 Akron Ohio 2005 112 Cincinatti Ohio 2004 113 Madison Wiconsin 2006 114 Madison Whsconsin 2006 115 Milwaukee Whconsin 2007 Milwaukee Wisconsin 2007 Milwaukee Wisconsin 2007 118 Cedar Rapids lowa 2008 119 Cedar Rapids low 2008 120 Cedar Rapids lowa 2009 121 Des Moines lowa 2009 122 Lansing Michigan 2010 123 Green Bay Wisconsin 124 Columbus Ohio 2011 Davenport Towa 2011 126 Livonis Michigan 2014 TOTAL SALES AND ROYALTY FEES 354,268 554,213 461,857 512,463 325,496 745,865 451,236 554,168 653,856 541,285 347,856 568,457 641,257 347,865 401.5 504,796 310,496 300,000 400,000 500.000 600,000 700.000 300.000 2010 125 Variables What Analysis Table Variable Data Table Step by Step Solution
There are 3 Steps involved in it
Step: 1

Get Instant Access to Expert-Tailored Solutions
See step-by-step solutions with expert insights and AI powered tools for academic success
Step: 2

Step: 3

Ace Your Homework with AI
Get the answers you need in no time with our AI-driven, step-by-step assistance
Get Started


