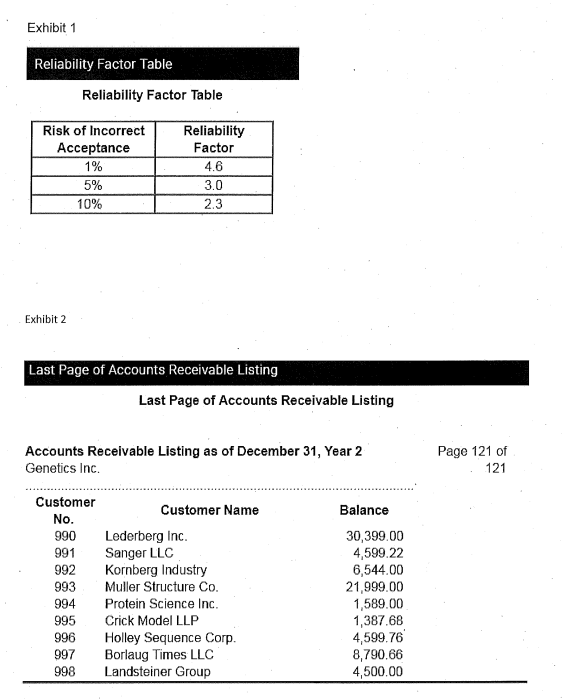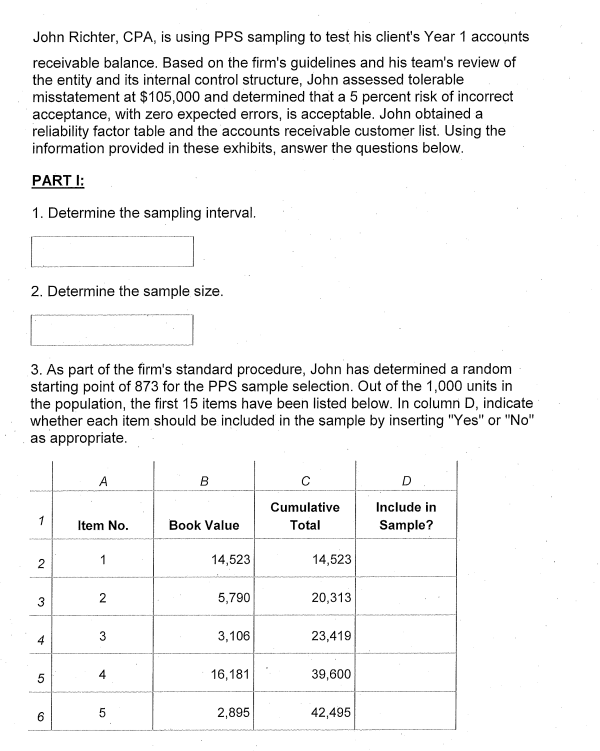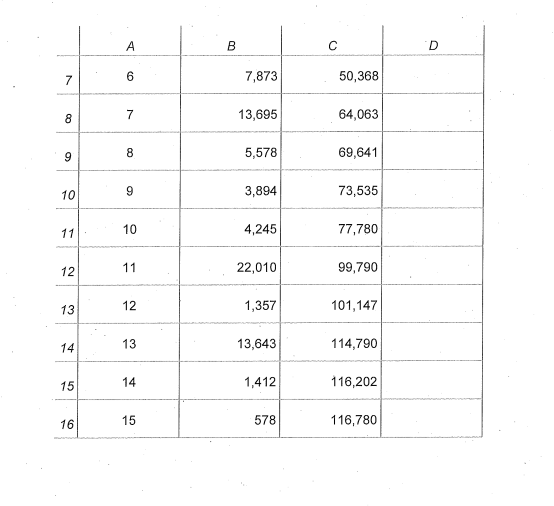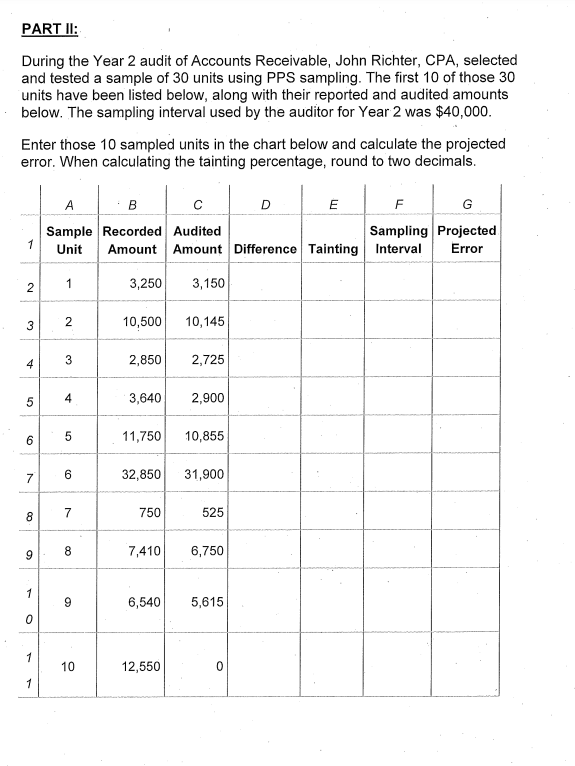


Exhibit 1 Reliability Factor Table Reliability Factor Table Risk of Incorrect Acceptance 1% 5% 10% Reliability Factor 4.6 3.0 2.3 Exhibit 2 Last Page of Accounts Receivable Listing Last Page of Accounts Receivable Listing Accounts Receivable Listing as of December 31, Year 2 Genetics Inc. Page 121 of 121 Customer No. 990 991 992 993 Customer Name Lederberg Inc. Sanger LLC Kornberg Industry Muller Structure Co. Protein Science Inc. Crick Model LLP Holley Sequence Corp. Borlaug Times LLC Landsteiner Group Balance 30,399.00 4,599.22 6,544.00 21,999.00 1,589.00 1,387.68 4,599.76 8,790.66 4,500.00 994 995 996 997 998 John Richter, CPA, is using PPS sampling to test his client's Year 1 accounts receivable balance. Based on the firm's guidelines and his team's review of the entity and its internal control structure, John assessed tolerable misstatement at $105,000 and determined that a 5 percent risk of incorrect acceptance, with zero expected errors, is acceptable. John obtained a reliability factor table and the accounts receivable customer list. Using the information provided in these exhibits, answer the questions below. PARTI: 1. Determine the sampling interval. 2. Determine the sample size. 3. As part of the firm's standard procedure, John has determined a random starting point of 873 for the PPS sample selection. Out of the 1,000 units in the population, the first 15 items have been listed below. In column D, indicate whether each item should be included in the sample by inserting "Yes" or "No" as appropriate. B D Include in Sample? 1 Cumulative Total 1 Item No. Book Value 2 2 1 14,523 14,523 3 N 5,790 20,313 4 3 3,106 23,419 5 4 16,181 39,600 6 5 2,895 42,495 B D 7 6 7,873 50,368 8 00 7 13,695 64,063 9 8 5,578 69,641 10 9 3,894 73,535 11 10 4,245 77,780 12 11 22,010 99,790 13 12 1,357 101,147 14 13 13,643 114,790 15 14 1,412 116,202 16 15 578 116,780 PART II: During the Year 2 audit of Accounts Receivable, John Richter, CPA, selected and tested a sample of 30 units using PPS sampling. The first 10 of those 30 units have been listed below, along with their reported and audited amounts below. The sampling interval used by the auditor for Year 2 was $40,000. Enter those 10 sampled units in the chart below and calculate the projected error. When calculating the tainting percentage, round to two decimals. B D E F G Sample Recorded Audited Sampling Projected Unit Amount Amount Difference Tainting Interval Error 1 2 1 3,250 3,150 3 2 10,500 10,145 3 3 4 2,850 2,725 4 3,640 2,900 6 5 11,750 10,855 7 6 32,850 31,900 8 7 750 525 8 9 7,410 6,750 1 9 6,540 5,615 0 1 10 12,550 0 1 Exhibit 1 Reliability Factor Table Reliability Factor Table Risk of Incorrect Acceptance 1% 5% 10% Reliability Factor 4.6 3.0 2.3 Exhibit 2 Last Page of Accounts Receivable Listing Last Page of Accounts Receivable Listing Accounts Receivable Listing as of December 31, Year 2 Genetics Inc. Page 121 of 121 Customer No. 990 991 992 993 Customer Name Lederberg Inc. Sanger LLC Kornberg Industry Muller Structure Co. Protein Science Inc. Crick Model LLP Holley Sequence Corp. Borlaug Times LLC Landsteiner Group Balance 30,399.00 4,599.22 6,544.00 21,999.00 1,589.00 1,387.68 4,599.76 8,790.66 4,500.00 994 995 996 997 998 John Richter, CPA, is using PPS sampling to test his client's Year 1 accounts receivable balance. Based on the firm's guidelines and his team's review of the entity and its internal control structure, John assessed tolerable misstatement at $105,000 and determined that a 5 percent risk of incorrect acceptance, with zero expected errors, is acceptable. John obtained a reliability factor table and the accounts receivable customer list. Using the information provided in these exhibits, answer the questions below. PARTI: 1. Determine the sampling interval. 2. Determine the sample size. 3. As part of the firm's standard procedure, John has determined a random starting point of 873 for the PPS sample selection. Out of the 1,000 units in the population, the first 15 items have been listed below. In column D, indicate whether each item should be included in the sample by inserting "Yes" or "No" as appropriate. B D Include in Sample? 1 Cumulative Total 1 Item No. Book Value 2 2 1 14,523 14,523 3 N 5,790 20,313 4 3 3,106 23,419 5 4 16,181 39,600 6 5 2,895 42,495 B D 7 6 7,873 50,368 8 00 7 13,695 64,063 9 8 5,578 69,641 10 9 3,894 73,535 11 10 4,245 77,780 12 11 22,010 99,790 13 12 1,357 101,147 14 13 13,643 114,790 15 14 1,412 116,202 16 15 578 116,780 PART II: During the Year 2 audit of Accounts Receivable, John Richter, CPA, selected and tested a sample of 30 units using PPS sampling. The first 10 of those 30 units have been listed below, along with their reported and audited amounts below. The sampling interval used by the auditor for Year 2 was $40,000. Enter those 10 sampled units in the chart below and calculate the projected error. When calculating the tainting percentage, round to two decimals. B D E F G Sample Recorded Audited Sampling Projected Unit Amount Amount Difference Tainting Interval Error 1 2 1 3,250 3,150 3 2 10,500 10,145 3 3 4 2,850 2,725 4 3,640 2,900 6 5 11,750 10,855 7 6 32,850 31,900 8 7 750 525 8 9 7,410 6,750 1 9 6,540 5,615 0 1 10 12,550 0 1


