

The 9 companies are drawn from the following 9 different industries: Liquor producer and distributor Discount airline Commercial bank (items fitted into the same categories
The 9 companies are drawn from the following 9 different industries:
Liquor producer and distributor
Discount airline
Commercial bank (items fitted into the same categories as the non-financial firms)
Match with the information below. and give some explanation.
Computer software company
Large integrated oil and gas company
The mobile phone service operator
R&D-based pharmaceutical manufacturer
Retail grocery company
R&D-based semiconductor manufacturer
this is all information estimate base on this info
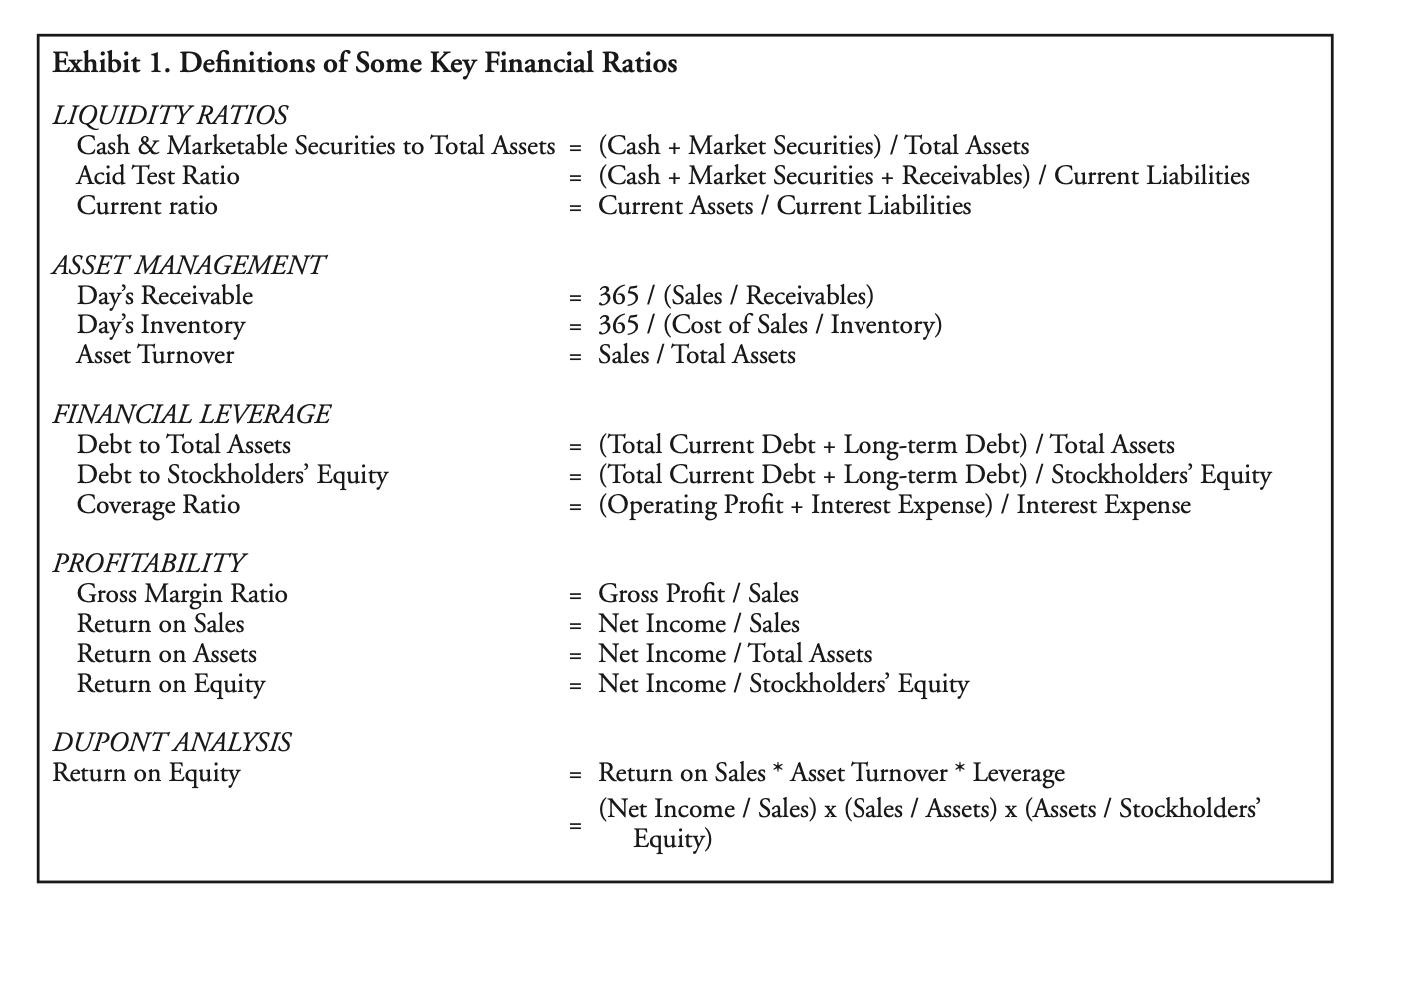
Exhibit 1. Definitions of Some Key Financial Ratios LIQUIDITY RATIOS Cash & Marketable Securities to Total Assets = Acid Test Ratio (Cash + Market Securities) / Total Assets (Cash + Market Securities + Receivables) / Current Liabilities = Current Assets / Current Liabilities Current ratio ASSET MANAGEMENT Day's Receivable Day's Inventory Asset Turnover = 365 / (Sales / Receivables) = 365 / (Cost of Sales / Inventory) Sales / Total Assets FINANCIAL LEVERAGE Debt to Total Assets Debt to Stockholders' Equity Coverage Ratio (Total Current Debt + Long-term Debt) / Total Assets (Total Current Debt + Long-term Debt) / Stockholders' Equity (Operating Profit + Interest Expense) / Interest Expense PROFITABILITY = Gross Profit / Sales = Net Income / Sales = Net Income / Total Assets = Net Income / Stockholders' Equity Gross Margin Ratio Return on Sales Return on Assets Return on Equity DUPONT ANALYSIS Return on Equity Return on Sales * Asset Turnover * Leverage (Net Income / Sales) x (Sales / Assets) x (Assets / Stockholders' Equity) %3D
Step by Step Solution
3.53 Rating (163 Votes )
There are 3 Steps involved in it
Step: 1
Financial Industry Commercial banks These firms have high expectations of being granted high loans and payables have high rates of assets compared to ... View full answer

Get step-by-step solutions from verified subject matter experts
100% Satisfaction Guaranteed-or Get a Refund!
Step: 2Unlock detailed examples and clear explanations to master concepts

Step: 3Unlock to practice, ask and learn with real-world examples
See step-by-step solutions with expert insights and AI powered tools for academic success
-
 Access 30 Million+ textbook solutions.
-
Ask unlimited questions from AI Tutors.
-
Order free textbooks.
-
100% Satisfaction Guaranteed-or Get a Refund!
Claim Your Hoodie Now!
Authors: Flawrence Revsine, Daniel Collins, Bruce, Mittelstaedt, Leon
6th edition
9780077632182, 78025672, 77632184, 978-0078025679

Study Smart with AI Flashcards
Access a vast library of flashcards, create your own, and experience a game-changing transformation in how you learn and retain knowledge
Explore Flashcards

