

Answered step by step
Verified Expert Solution
Question
1 Approved Answer
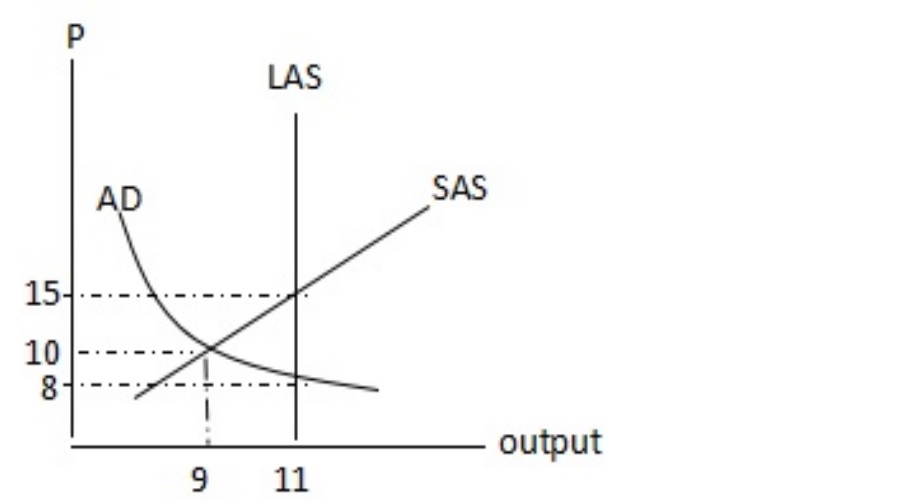
The above figure shows a macroeconomic equilibrium. The equilibrium achieved is A at real GDP greater than potential GDP B a short run equilibrium C
The above figure shows a macroeconomic equilibrium. The equilibrium achieved is
A
at real GDP greater than potential GDPB
a short run equilibriumC
at real GDP equal potential GDPD
a long run equilibrium
Step by Step Solution
There are 3 Steps involved in it
Step: 1

Get Instant Access to Expert-Tailored Solutions
See step-by-step solutions with expert insights and AI powered tools for academic success
Step: 2

Step: 3
Ace Your Homework with AI
Get the answers you need in no time with our AI-driven, step-by-step assistance
Get Started
Macroeconomics Principles and Applications
Authors: Robert e. hall, marc Lieberman
5th edition
1111397465, 9781439038970, 1439038988, 978-1111397463, 143903897X, 9781439038987, 978-1133265238