

Answered step by step
Verified Expert Solution
Question
1 Approved Answer
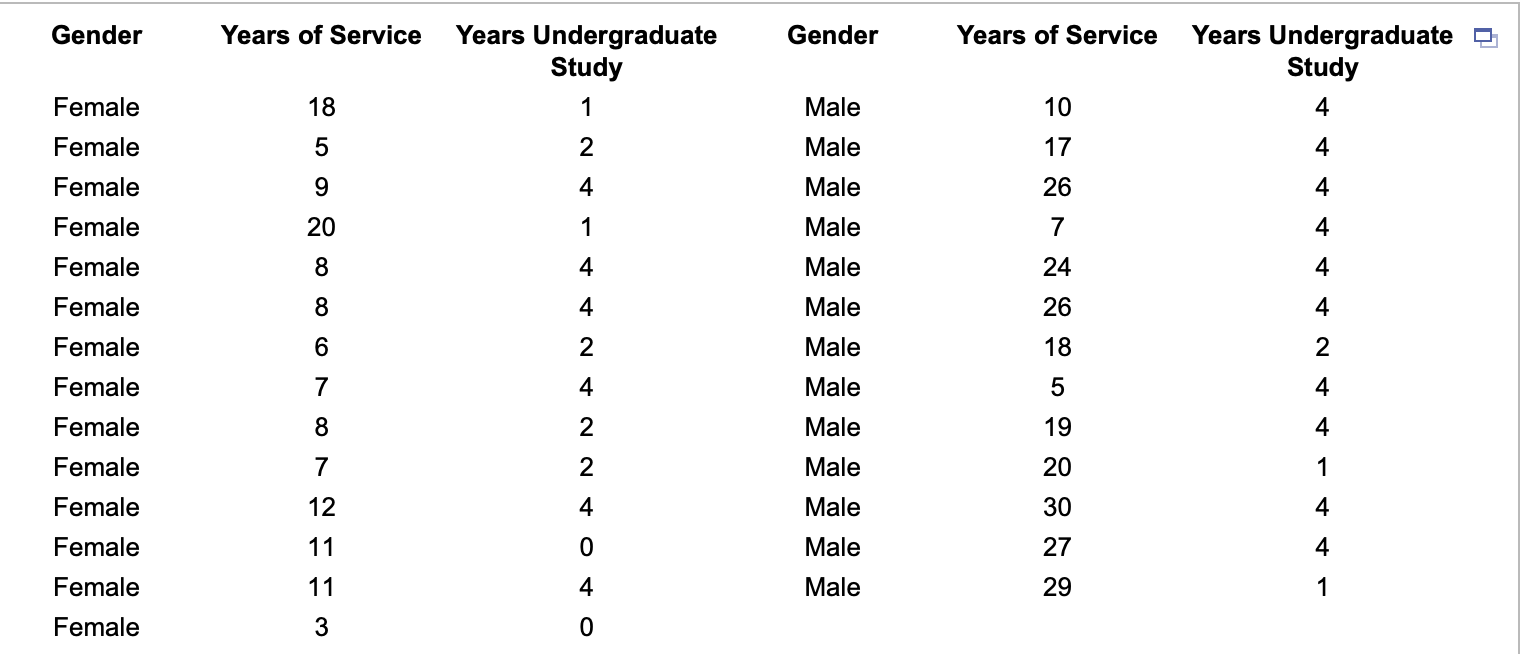
The accompanying data provides the results of a survey of 27 employees in a tax division of a Fortune 100 company.a. Test the null hypothesis
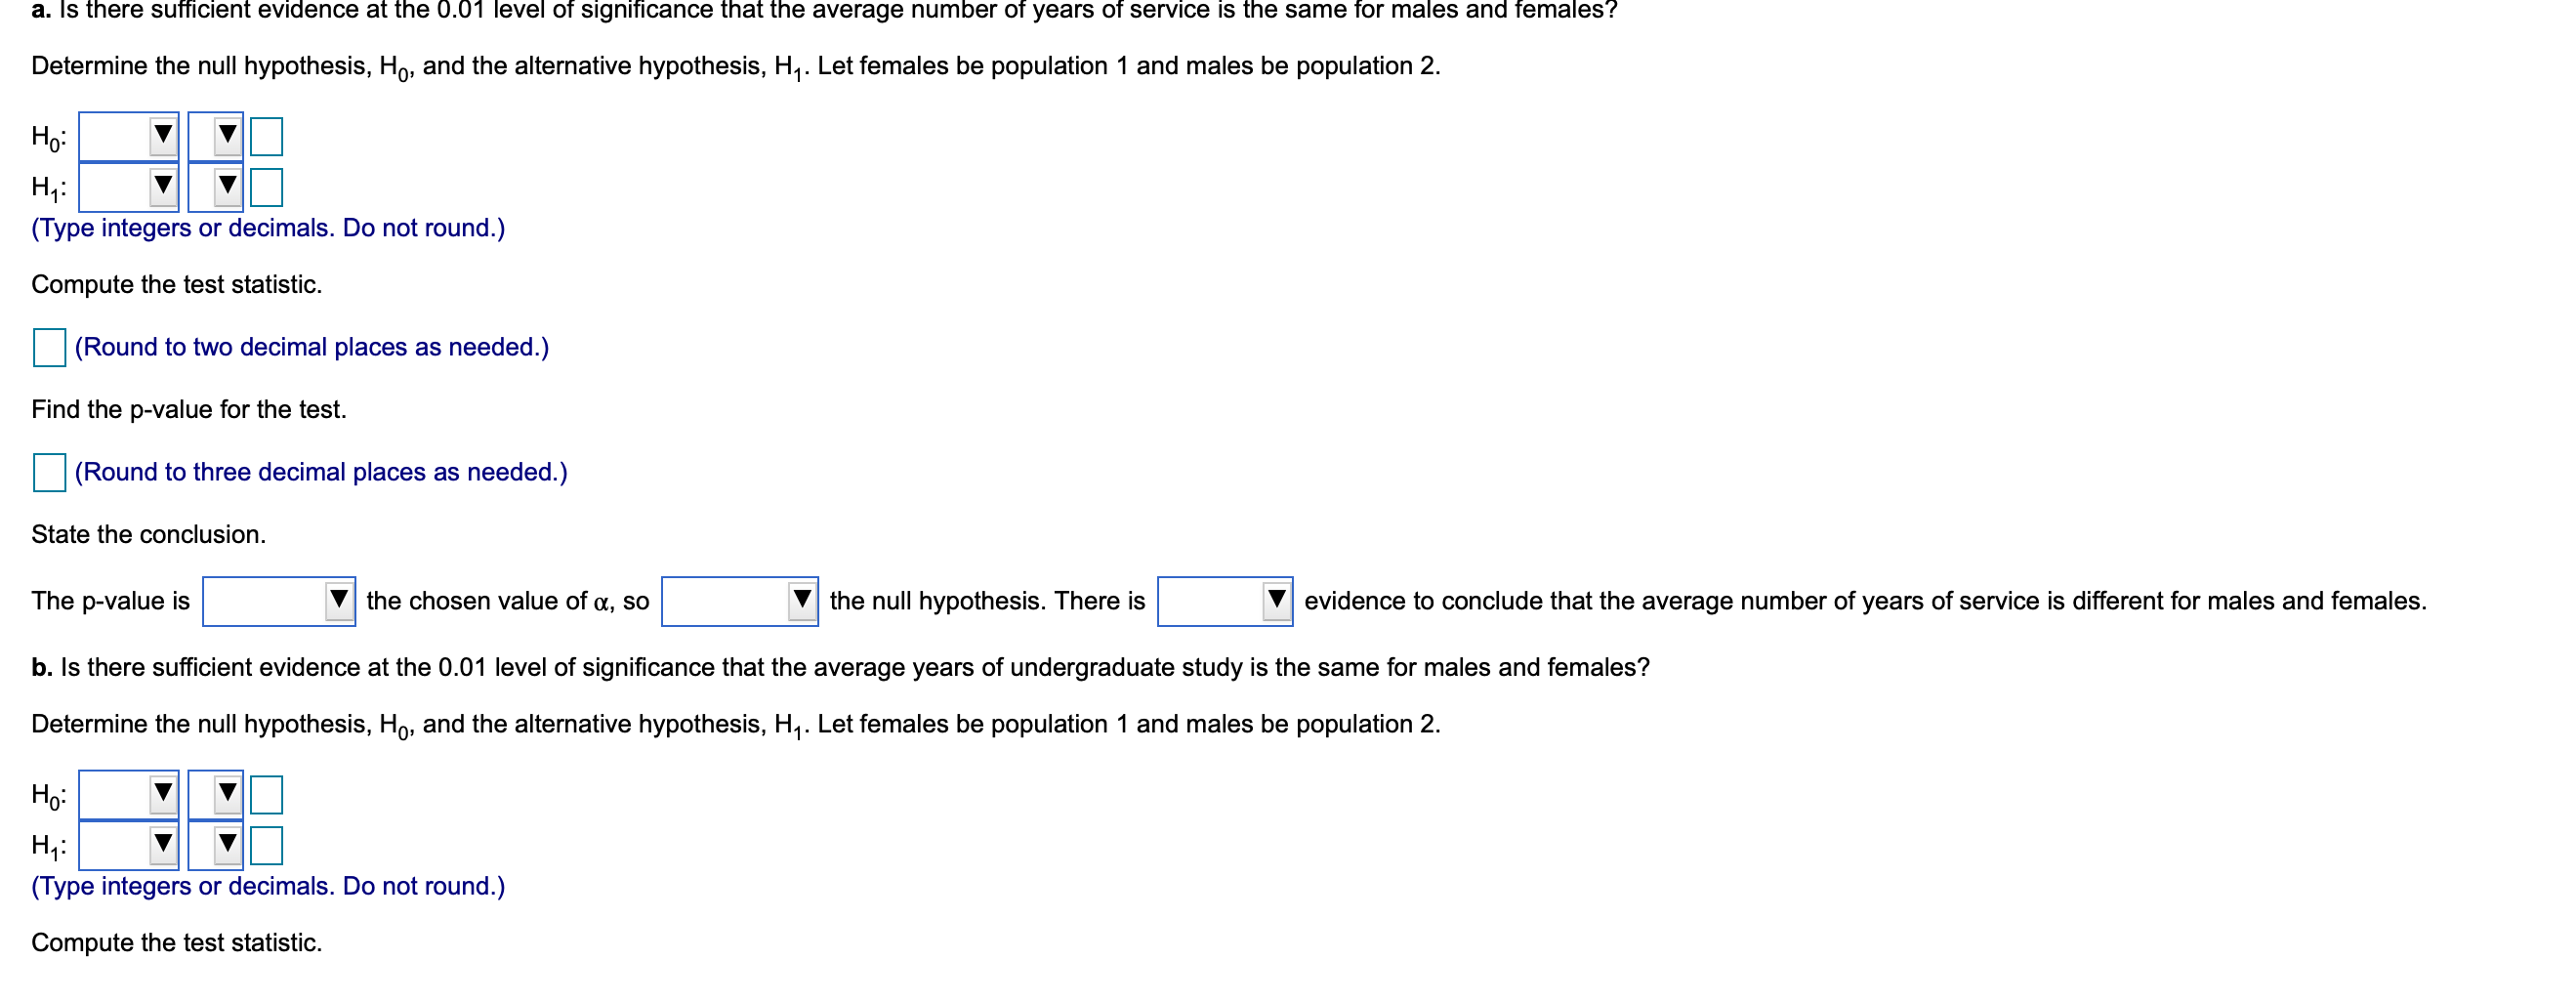
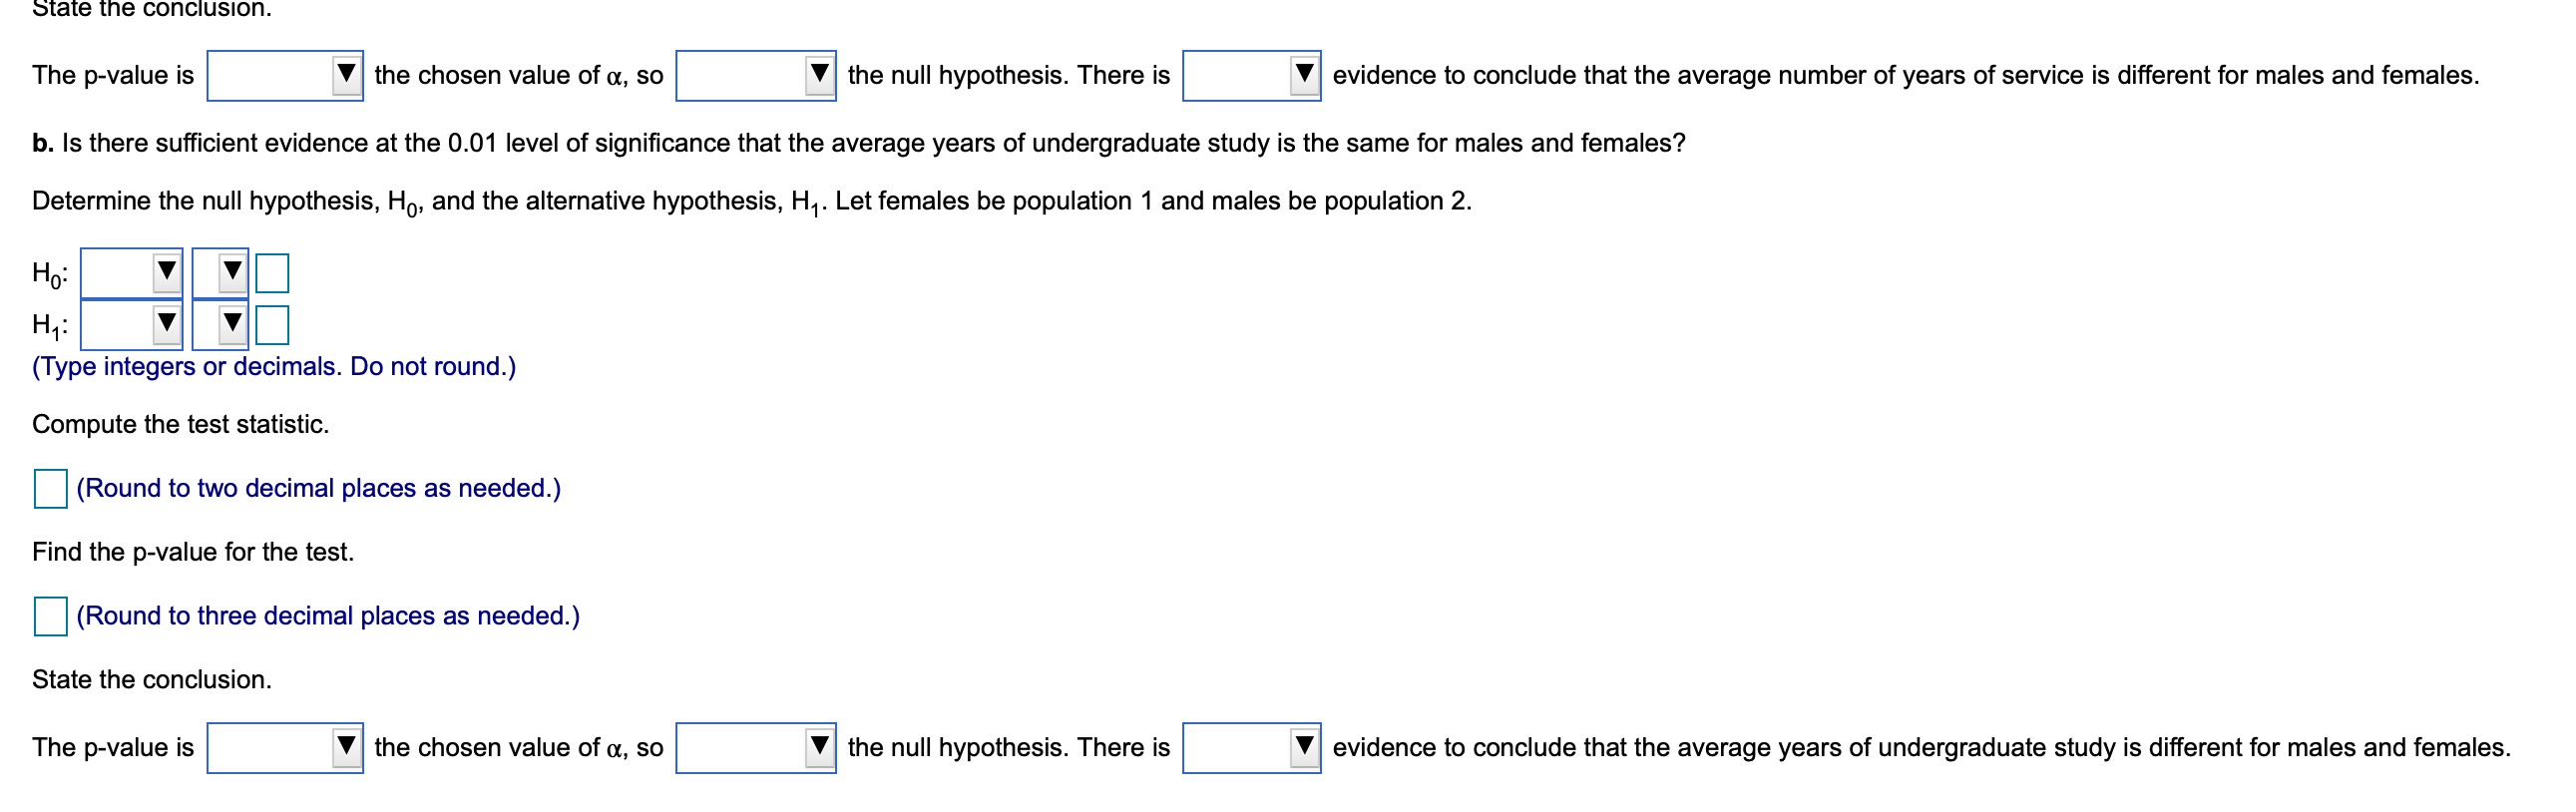
The accompanying data provides the results of a survey of 27 employees in a tax division of a Fortune 100 company.a. Test the null hypothesis that the average number of years of service is the same for males and females. Assume that the population variances are unequal.b. Test the null hypothesis that the average years of undergraduate study is the same for males and females. Assume that the population variances are unequal.
Step by Step Solution
There are 3 Steps involved in it
Step: 1

Get Instant Access to Expert-Tailored Solutions
See step-by-step solutions with expert insights and AI powered tools for academic success
Step: 2

Step: 3
Ace Your Homework with AI
Get the answers you need in no time with our AI-driven, step-by-step assistance
Get Started