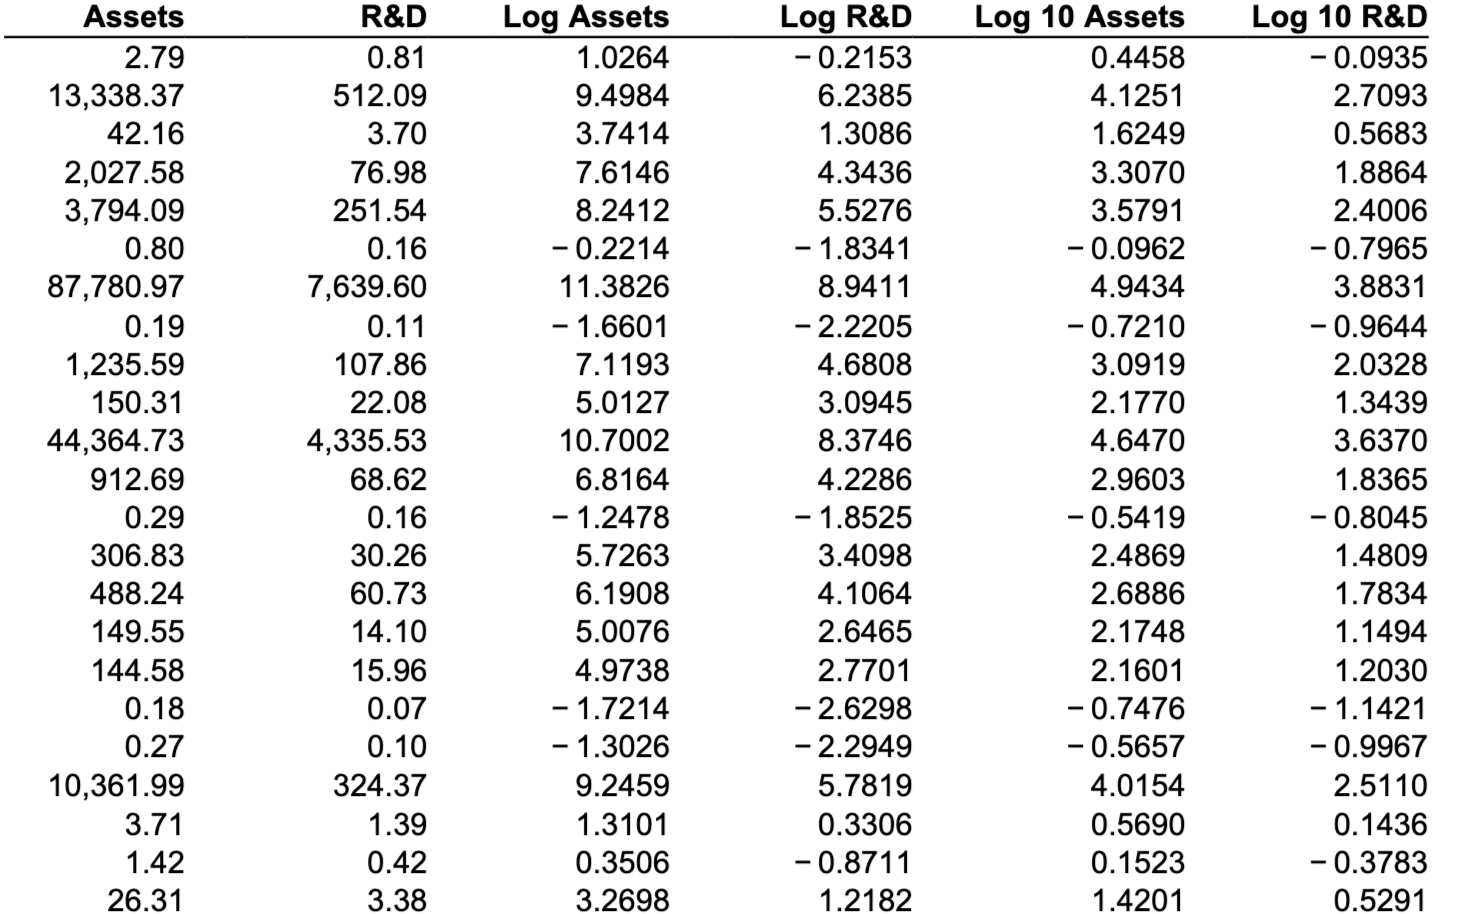
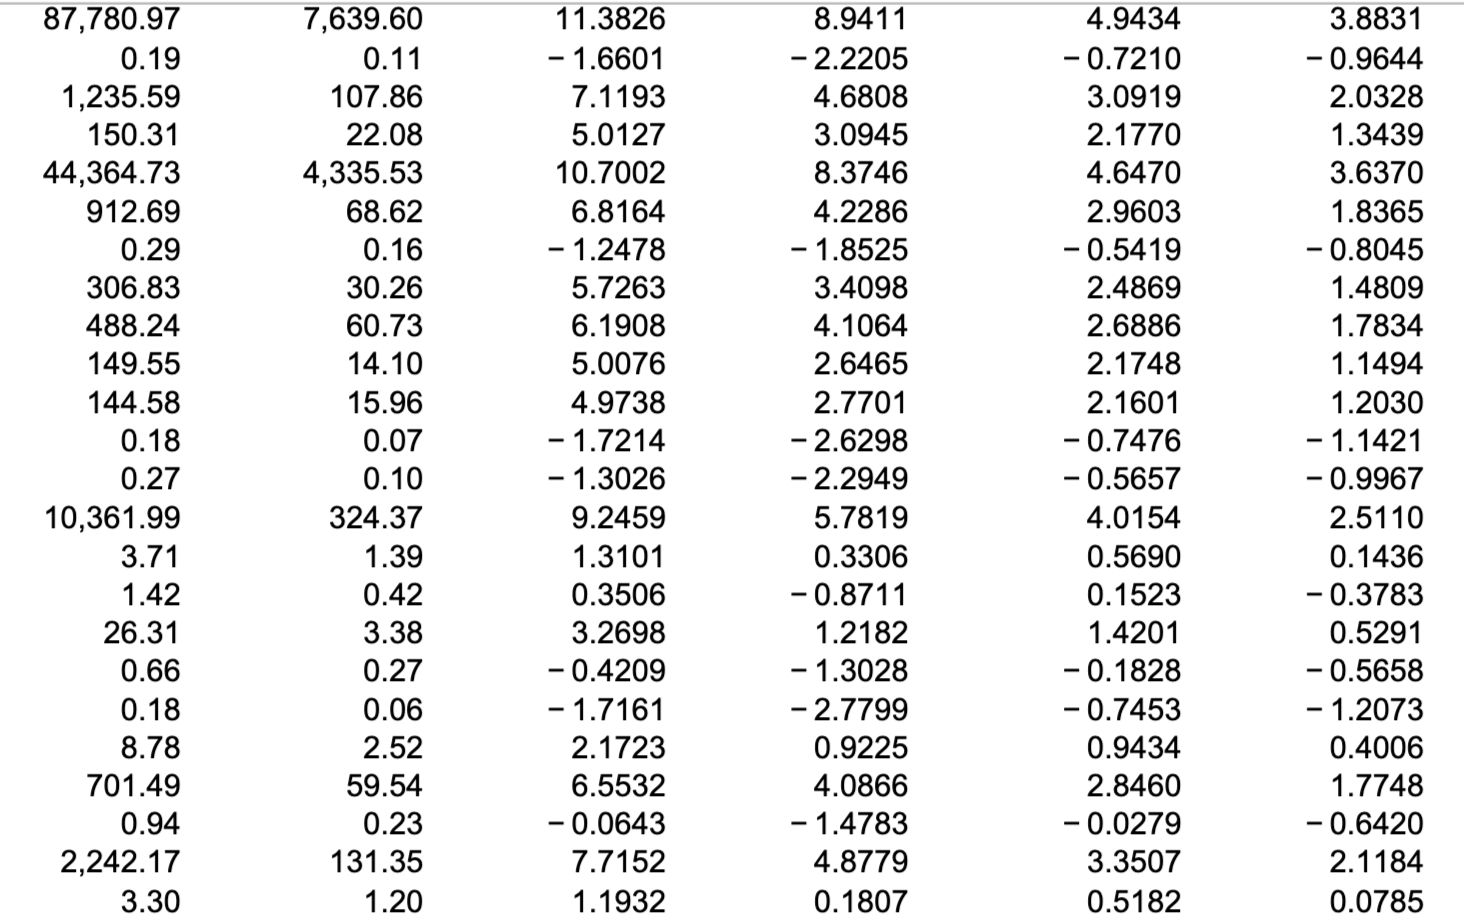
The accompanying data table contains financial data for 30 random technology companies. One column gives the expenses on research and development (R&D), and another gives the total assets of the 30 companies. Both of these columns are reported in millions of dollars. The data need to be expressed on a log scale; otherwise, two outlying companies dominate the analysis. Use the natural logs of both variables rather than the original variables in the data table. (Note that the variables are recorded in millions, so 1,000=1 billion.) Complete parts (a) through (c).
JUST NEED HELP WITH C


(c) Find a 95% prediction interval for the R\&D expenses of a firm with $1 billion in assets. Be sure to express your range on a dollar scale. Do you expect this interval to have 95% coverage? The R&D expenses for a firm with $1 billion in assets would be between $ million and $ million. (Round to one decimal place as needed.) \begin{tabular}{rrrrrr} Assets & R\&D & Log Assets & Log R\&D & Log 10 Assets & Log 10 R\&D \\ \hline 2.79 & 0.81 & 1.0264 & 0.2153 & 0.4458 & 0.0935 \\ 13,338.37 & 512.09 & 9.4984 & 6.2385 & 4.1251 & 2.7093 \\ 42.16 & 3.70 & 3.7414 & 1.3086 & 1.6249 & 0.5683 \\ 2,027.58 & 76.98 & 7.6146 & 4.3436 & 3.3070 & 1.8864 \\ 3,794.09 & 251.54 & 8.2412 & 5.5276 & 3.5791 & 2.4006 \\ 0.80 & 0.16 & 0.2214 & 1.8341 & 0.0962 & 0.7965 \\ 87,780.97 & 7,639.60 & 11.3826 & 8.9411 & 4.9434 & 3.8831 \\ 0.19 & 0.11 & 1.6601 & 2.2205 & 0.7210 & 0.9644 \\ 1,235.59 & 107.86 & 7.1193 & 4.6808 & 3.0919 & 2.0328 \\ 150.31 & 22.08 & 5.0127 & 3.0945 & 2.1770 & 1.3439 \\ 44,364.73 & 4,335.53 & 10.7002 & 8.3746 & 4.6470 & 3.6370 \\ 912.69 & 68.62 & 6.8164 & 4.2286 & 2.9603 & 1.8365 \\ 0.29 & 0.16 & 1.2478 & 1.8525 & 0.5419 & 0.8045 \\ 306.83 & 30.26 & 5.7263 & 3.4098 & 2.4869 & 1.4809 \\ 488.24 & 60.73 & 6.1908 & 4.1064 & 2.6886 & 1.7834 \\ 149.55 & 14.10 & 5.0076 & 2.6465 & 2.1748 & 1.1494 \\ 144.58 & 15.96 & 4.9738 & 2.7701 & 2.1601 & 1.2030 \\ 0.18 & 0.07 & 1.7214 & 2.6298 & 0.7476 & 1.1421 \\ 0.27 & 0.10 & 1.3026 & 2.2949 & 0.5657 & 0.9967 \\ 10,361.99 & 324.37 & 9.2459 & 5.7819 & 4.0154 & 2.5110 \\ 3.71 & 1.39 & 1.3101 & 0.3306 & 0.5690 & 0.1436 \\ 1.42 & 0.42 & 0.3506 & 0.8711 & 0.1523 & 0.3783 \\ 26.31 & 3.38 & 3.2698 & 1.2182 & 1.4201 & 0.5291 \end{tabular} 87,780.970.191,235.59150.3144,364.73912.690.29306.83488.24149.55144.580.180.2710,361.993.711.4226.310.660.188.78701.490.942,242.173.307,639.600.11107.8622.084,335.5368.620.1630.2660.7314.1015.960.070.10324.371.390.423.380.270.062.5259.540.23131.351.2011.38261.66017.11935.012710.70026.81641.24785.72636.19085.00764.97381.72141.30269.24591.31010.35063.26980.42091.71612.17236.55320.06437.71521.19328.94112.22054.68083.09458.37464.22861.85253.40984.10642.64652.77012.62982.29495.78190.33060.87111.21821.30282.77990.92254.08661.47834.87790.18074.94340.72103.09192.17704.64702.96030.54192.48692.68862.17482.16010.74760.56574.01540.56900.15231.42010.18280.74530.94342.84600.02793.35070.51823.88310.96442.03281.34393.63701.83650.80451.48091.78341.14941.20301.14210.99672.51100.14360.37830.52910.56581.20730.40061.77480.64202.11840.0785 (c) Find a 95% prediction interval for the R\&D expenses of a firm with $1 billion in assets. Be sure to express your range on a dollar scale. Do you expect this interval to have 95% coverage? The R&D expenses for a firm with $1 billion in assets would be between $ million and $ million. (Round to one decimal place as needed.) \begin{tabular}{rrrrrr} Assets & R\&D & Log Assets & Log R\&D & Log 10 Assets & Log 10 R\&D \\ \hline 2.79 & 0.81 & 1.0264 & 0.2153 & 0.4458 & 0.0935 \\ 13,338.37 & 512.09 & 9.4984 & 6.2385 & 4.1251 & 2.7093 \\ 42.16 & 3.70 & 3.7414 & 1.3086 & 1.6249 & 0.5683 \\ 2,027.58 & 76.98 & 7.6146 & 4.3436 & 3.3070 & 1.8864 \\ 3,794.09 & 251.54 & 8.2412 & 5.5276 & 3.5791 & 2.4006 \\ 0.80 & 0.16 & 0.2214 & 1.8341 & 0.0962 & 0.7965 \\ 87,780.97 & 7,639.60 & 11.3826 & 8.9411 & 4.9434 & 3.8831 \\ 0.19 & 0.11 & 1.6601 & 2.2205 & 0.7210 & 0.9644 \\ 1,235.59 & 107.86 & 7.1193 & 4.6808 & 3.0919 & 2.0328 \\ 150.31 & 22.08 & 5.0127 & 3.0945 & 2.1770 & 1.3439 \\ 44,364.73 & 4,335.53 & 10.7002 & 8.3746 & 4.6470 & 3.6370 \\ 912.69 & 68.62 & 6.8164 & 4.2286 & 2.9603 & 1.8365 \\ 0.29 & 0.16 & 1.2478 & 1.8525 & 0.5419 & 0.8045 \\ 306.83 & 30.26 & 5.7263 & 3.4098 & 2.4869 & 1.4809 \\ 488.24 & 60.73 & 6.1908 & 4.1064 & 2.6886 & 1.7834 \\ 149.55 & 14.10 & 5.0076 & 2.6465 & 2.1748 & 1.1494 \\ 144.58 & 15.96 & 4.9738 & 2.7701 & 2.1601 & 1.2030 \\ 0.18 & 0.07 & 1.7214 & 2.6298 & 0.7476 & 1.1421 \\ 0.27 & 0.10 & 1.3026 & 2.2949 & 0.5657 & 0.9967 \\ 10,361.99 & 324.37 & 9.2459 & 5.7819 & 4.0154 & 2.5110 \\ 3.71 & 1.39 & 1.3101 & 0.3306 & 0.5690 & 0.1436 \\ 1.42 & 0.42 & 0.3506 & 0.8711 & 0.1523 & 0.3783 \\ 26.31 & 3.38 & 3.2698 & 1.2182 & 1.4201 & 0.5291 \end{tabular} 87,780.970.191,235.59150.3144,364.73912.690.29306.83488.24149.55144.580.180.2710,361.993.711.4226.310.660.188.78701.490.942,242.173.307,639.600.11107.8622.084,335.5368.620.1630.2660.7314.1015.960.070.10324.371.390.423.380.270.062.5259.540.23131.351.2011.38261.66017.11935.012710.70026.81641.24785.72636.19085.00764.97381.72141.30269.24591.31010.35063.26980.42091.71612.17236.55320.06437.71521.19328.94112.22054.68083.09458.37464.22861.85253.40984.10642.64652.77012.62982.29495.78190.33060.87111.21821.30282.77990.92254.08661.47834.87790.18074.94340.72103.09192.17704.64702.96030.54192.48692.68862.17482.16010.74760.56574.01540.56900.15231.42010.18280.74530.94342.84600.02793.35070.51823.88310.96442.03281.34393.63701.83650.80451.48091.78341.14941.20301.14210.99672.51100.14360.37830.52910.56581.20730.40061.77480.64202.11840.0785


