Answered step by step
Verified Expert Solution
Link Copied!

Question

1 Approved Answer

The accompanying table gives the results of a survey of 19 patients at a hospital, with 95% confidence intervals. Construct a stock chart-based visualization of
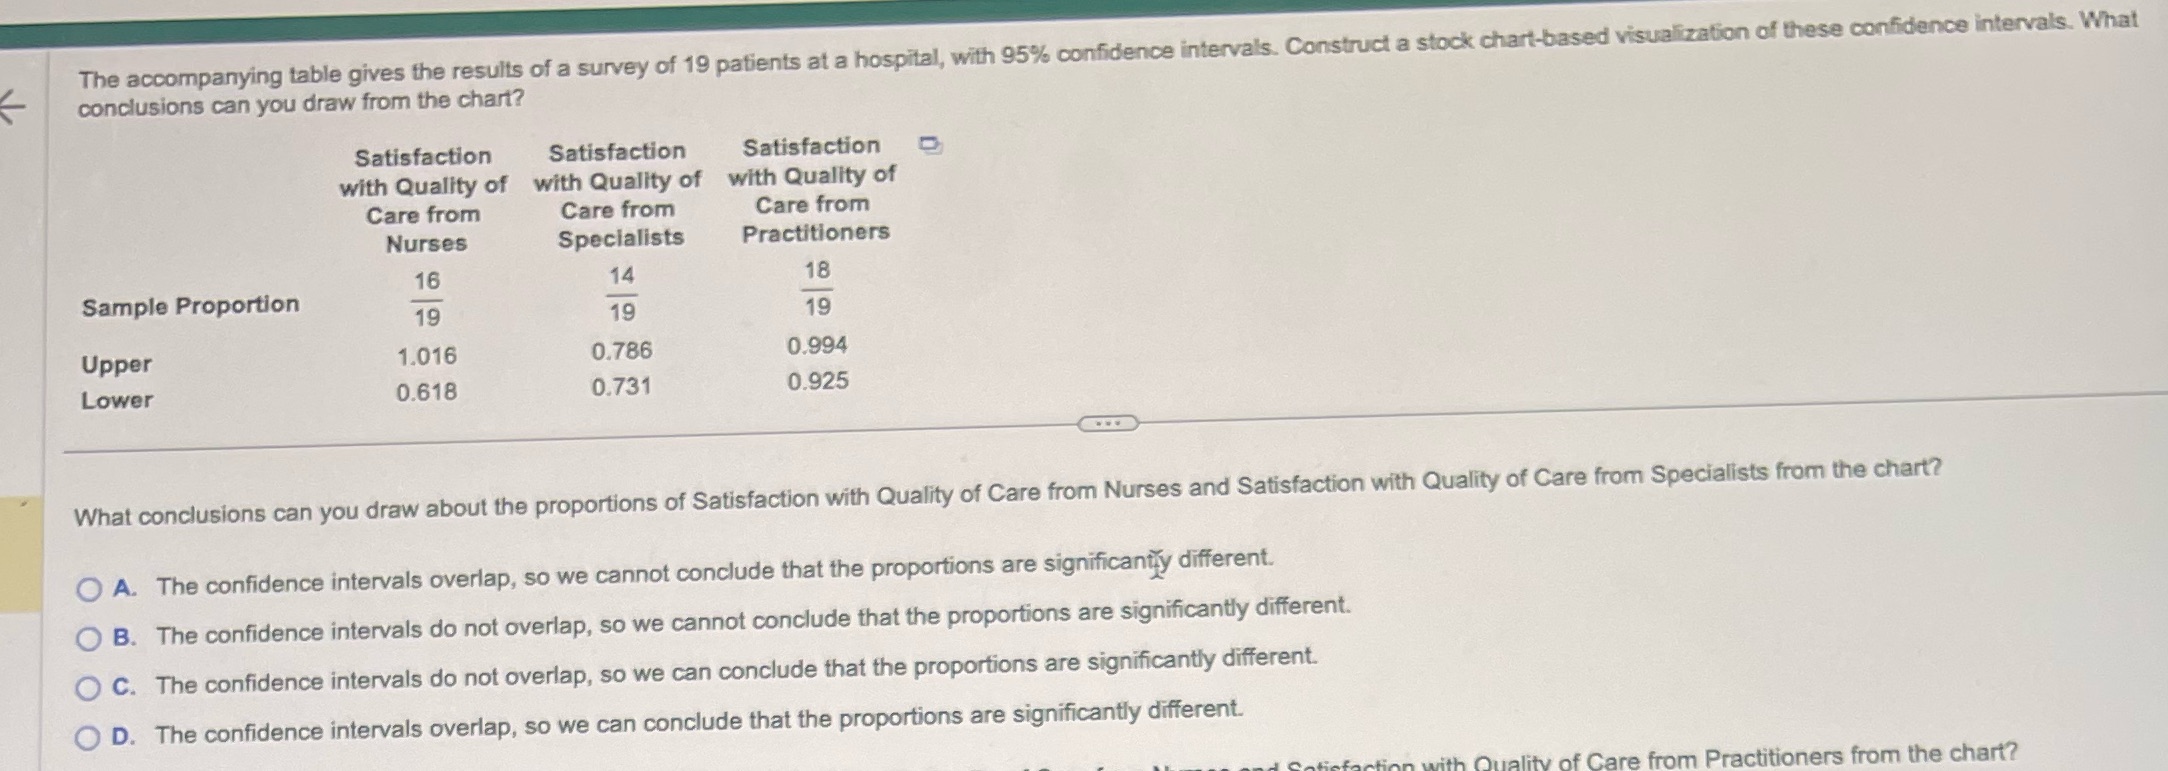
image text in transcribed
The accompanying table gives the results of a survey of 19 patients at a hospital, with 95% confidence intervals. Construct a stock chart-based visualization of these confidence intervals. What conclusions can you draw from the chart? Satisfaction Satisfaction Satisfaction with Quality of with Quality of with Quality of Care from Care from Care from Nurses Specialists Practitioners 16 14 18 Sample Proportion 19 19 19 Upper 1.016 0.786 0.994 Lower 0.618 0.731 0.925 What conclusions can you draw about the proportions of Satisfaction with Quality of Care from Nurses and Satisfaction with Quality of Care from Specialists from the chart? O A. The confidence intervals overlap, so we cannot conclude that the proportions are significantly different. B. The confidence intervals do not overlap, so we cannot conclude that the proportions are significantly different. O C. The confidence intervals do not overlap, so we can conclude that the proportions are significantly different. D. The confidence intervals overlap, so we can conclude that the proportions are significantly different. Care from Practitioners from the chart

Step by Step Solution

There are 3 Steps involved in it

Step: 1

blur-text-image

Get Instant Access to Expert-Tailored Solutions

See step-by-step solutions with expert insights and AI powered tools for academic success

Step: 2

blur-text-image_2

Step: 3

blur-text-image_3

Ace Your Homework with AI

Get the answers you need in no time with our AI-driven, step-by-step assistance

Get Started

Recommended Textbook for

Linear Algebra and Its Applications

Authors: Gilbert Strang

4th edition

30105678, 30105676, 978-0030105678

More Books

Students also viewed these Mathematics questions