Answered step by step
Verified Expert Solution
Question
1 Approved Answer
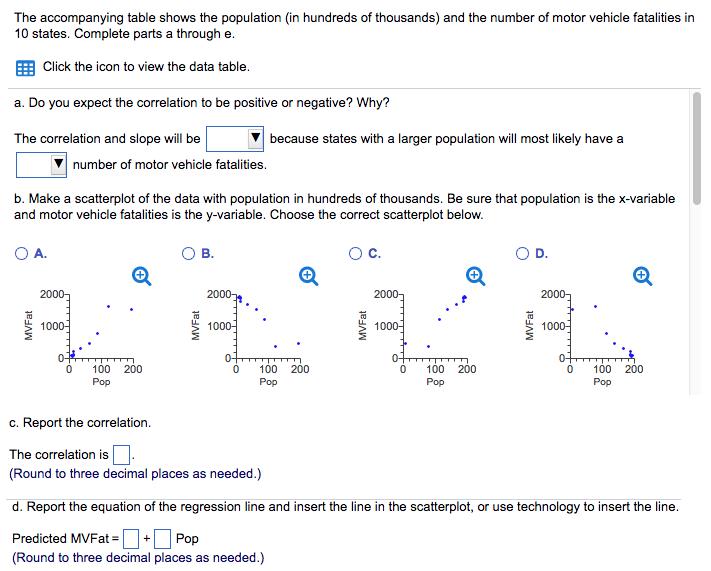
The accompanying table shows the population (in hundreds of thousands) and the number of motor vehicle fatalities in 10 states. Complete parts a through


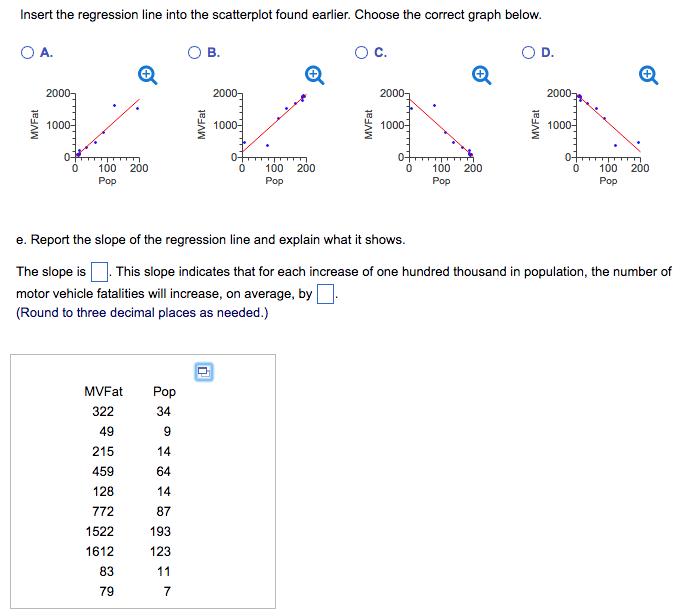
The accompanying table shows the population (in hundreds of thousands) and the number of motor vehicle fatalities in 10 states. Complete parts a through e. Click the icon to view the data table. a. Do you expect the correlation to be positive or negative? Why? The correlation and slope will be because states with a larger population will most likely have a number of motor vehicle fatalities. b. Make a scatterplot of the data with population in hundreds of thousands. Be sure that population is the x-variable and motor vehicle fatalities is the y-variable. Choose the correct scatterplot below. O A. . c. OD. 2000, 2000- 2000- 2000- 1000- 1000- 1000- 1000- 0- 0- 200 100 200 Pop 200 100 Pop 100 200 Pop 100 Pop c. Report the correlation. The correlation is (Round to three decimal places as needed.) d. Report the equation of the regression line and insert the line in the scatterplot, or use technology to insert the line. Predicted MVFat = + Pop (Round to three decimal places as needed.) MVFat MVFat MVFat MVFat Insert the regression line into the scatterplot found earlier. Choose the correct graph below. OA. . c. D. 2000- 2000- 2000- 2000- 1000- 1000 1000- 1000- 0-F - 0- 100 200 100 200 200 100 200 100 Pop Pop Pop Pop e. Report the slope of the regression line and explain what it shows. The slope is . This slope indicates that for each increase of one hundred thousand in population, the number of motor vehicle fatalities will increase, on average, by. (Round to three decimal places as needed.) MVFat Pop 322 34 49 9. 215 14 459 64 128 14 772 87 1522 193 1612 123 83 11 79 7 MVFat MVFat MVFat
Step by Step Solution
★★★★★
3.40 Rating (166 Votes )
There are 3 Steps involved in it
Step: 1

Get Instant Access to Expert-Tailored Solutions
See step-by-step solutions with expert insights and AI powered tools for academic success
Step: 2

Step: 3

Ace Your Homework with AI
Get the answers you need in no time with our AI-driven, step-by-step assistance
Get Started


