

Answered step by step
Verified Expert Solution
Question
1 Approved Answer
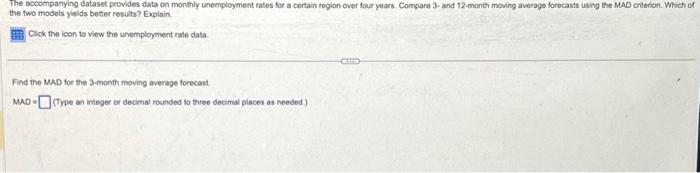
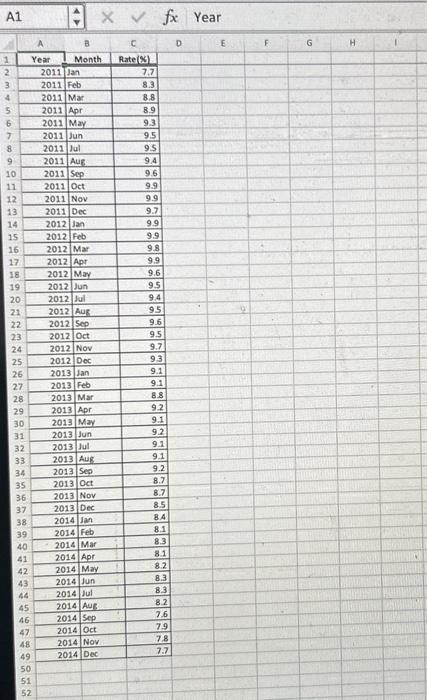
The acocomparying dataset provides diata on monthly unemployment tates for a cortain rogion ovor four years. Compare 3 - and 12 -month moving average forocasts
Step by Step Solution
There are 3 Steps involved in it
Step: 1

Get Instant Access to Expert-Tailored Solutions
See step-by-step solutions with expert insights and AI powered tools for academic success
Step: 2

Step: 3
Ace Your Homework with AI
Get the answers you need in no time with our AI-driven, step-by-step assistance
Get Started
Empirical Techniques In Finance
Authors: Ramaprasad Bhar, Shigeyuki Hamori
1st Edition
3642064175, 978-3642064173