

Question
The airline industry is severely hit by the COVID-19. Rows 6 to 85 show the daily closing prices of three stocks (i.e.,Qantas Airways Limited (QAN.AX),
The airline industry is severely hit by the COVID-19. Rows 6 to 85 show the daily closing prices of three stocks (i.e.,Qantas Airways Limited (QAN.AX), Singapore Airlines Limited (C6L.SI), and Cathay Pacific Airlines (0293.HK)) in the airline industry between 1 March 2021 and 23 June 2021. The data were collected from Yahoo Finance. When answering these questions, ignore dividends and assume all prices are in the same currency. Date Qantas Airways Limited (QAN.AX) Singapore Airlines Limited (C6L.SI) Cathay Pacific Airlines (0293.HK) 2021/3/1 5 5.24 7.29 2021/3/2 4.89 5.18 7.4 2021/3/3 5.03 5.21 7.41 2021/3/4 5.08 5.15 7.46 2021/3/5 5.1 5.15 7.41 2021/3/8 5.02 5.15 7 2021/3/9 5.14 5.31 7.1 2021/3/10 5.17 5.22 7.06 2021/3/11 5.3 5.32 7.39 2021/3/12 5.3 5.3 7.36 2021/3/15 5.5 5.63 7.56 2021/3/16 5.48 5.66 7.56 2021/3/17 5.45 5.67 7.71 2021/3/18 5.41 5.71 7.89 2021/3/19 5.35 5.7 7.62 2021/3/22 5.33 5.68 7.63 2021/3/23 5.21 5.64 7.25 2021/3/24 5.13 5.53 6.91 2021/3/25 5.11 5.59 7.09 2021/3/26 5.11 5.54 7.2 2021/3/29 5.07 5.55 7.21 2021/3/30 5 5.61 7.32 2021/3/31 5.09 5.55 7.25 2021/4/1 5.1 5.59 7.24 2021/4/6 5.26 5.59 7.23 2021/4/7 5.4 5.64 7.23 2021/4/8 5.42 5.7 7.1 2021/4/9 5.45 5.69 7.06 2021/4/12 5.32 5.72 7.07 2021/4/13 5.27 5.6 7.08 2021/4/14 5.21 5.53 7.02 2021/4/15 5.2 5.5 7.15 2021/4/16 5.18 5.34 7.13 2021/4/19 5.08 5.4 7.09 2021/4/20 5.01 5.23 6.94 2021/4/21 4.94 5.08 7 2021/4/22 5.01 4.99 6.9 202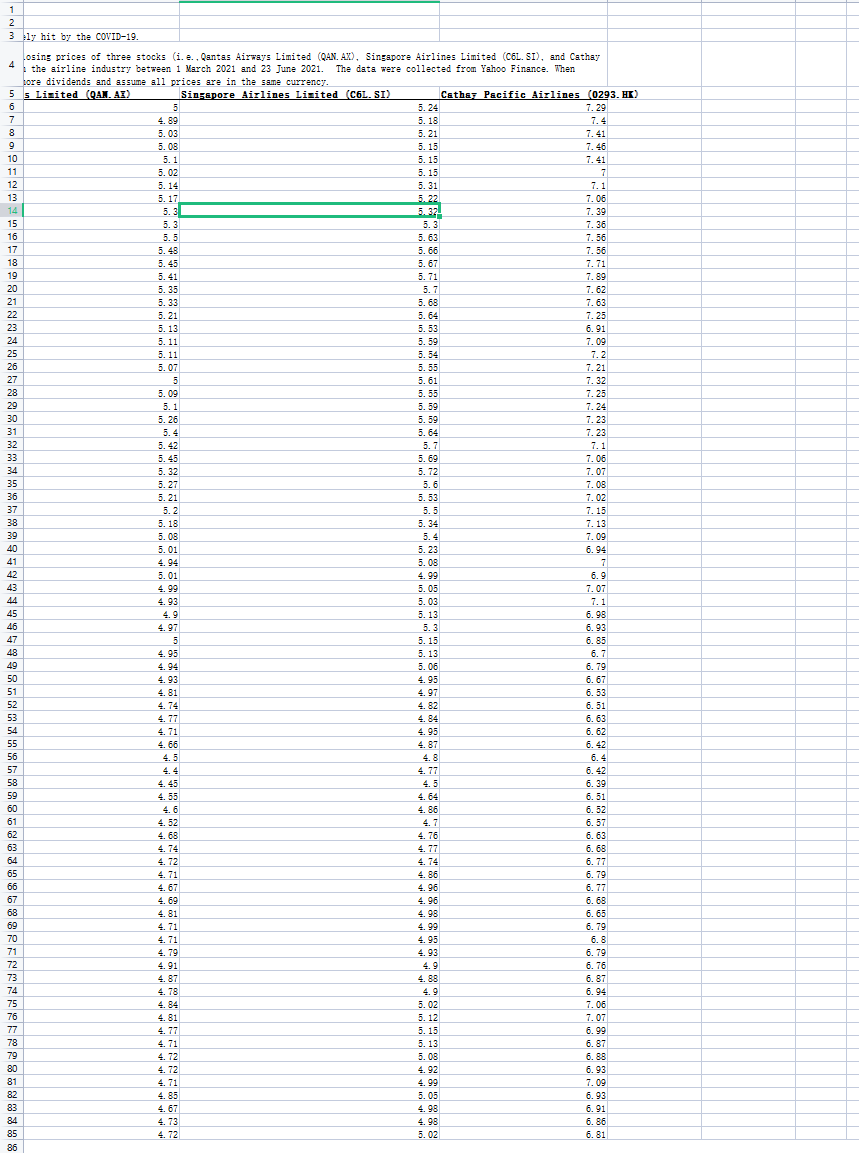
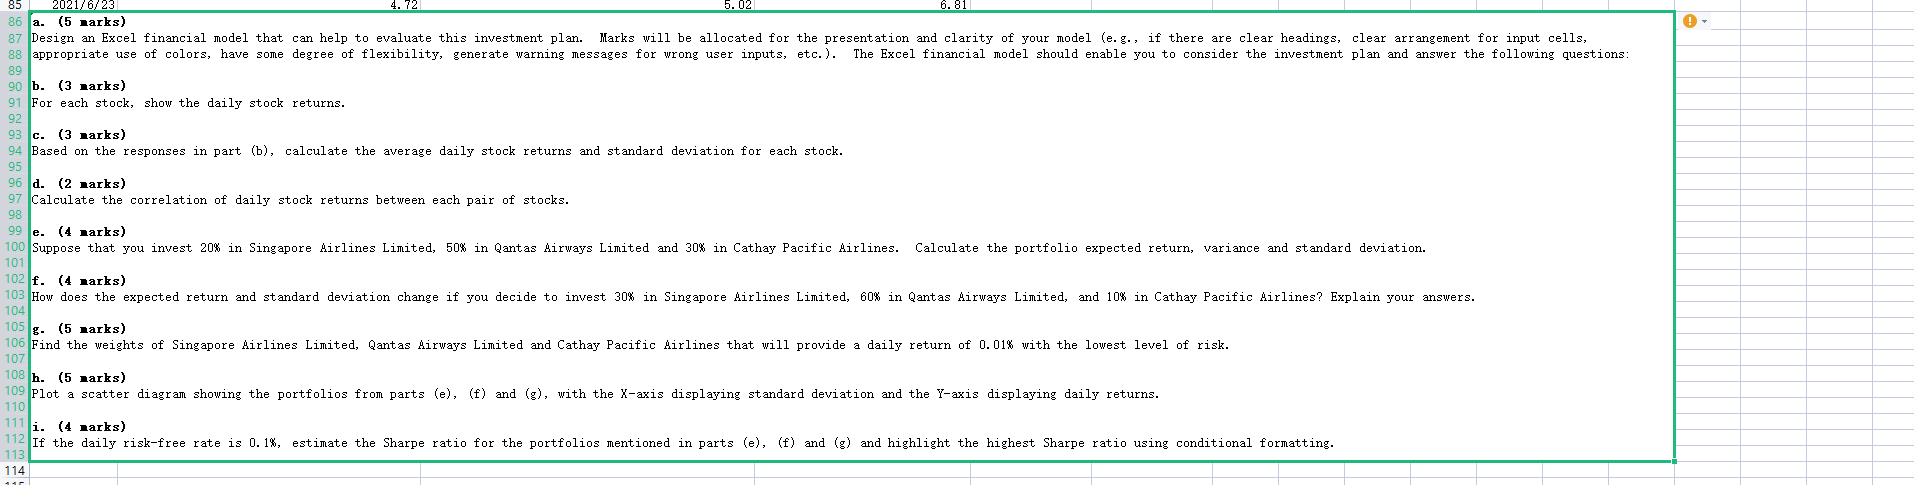 1/4/23 4.99 5.05 7.07 2021/4/26 4.93 5.03 7.1 2021/4/27 4.9 5.13 6.98 2021/4/28 4.97 5.3 6.93 2021/4/29 5 5.15 6.85 2021/4/30 4.95 5.13 6.7 2021/5/3 4.94 5.06 6.79 2021/5/4 4.93 4.95 6.67 2021/5/5 4.81 4.97 6.53 2021/5/6 4.74 4.82 6.51 2021/5/7 4.77 4.84 6.63 2021/5/10 4.71 4.95 6.62 2021/5/11 4.66 4.87 6.42 2021/5/12 4.5 4.8 6.4 2021/5/13 4.4 4.77 6.42 2021/5/14 4.45 4.5 6.39 2021/5/17 4.55 4.64 6.51 2021/5/18 4.6 4.86 6.52 2021/5/19 4.52 4.7 6.57 2021/5/20 4.68 4.76 6.63 2021/5/21 4.74 4.77 6.68 2021/5/24 4.72 4.74 6.77 2021/5/25 4.71 4.86 6.79 2021/5/26 4.67 4.96 6.77 2021/5/27 4.69 4.96 6.68 2021/5/28 4.81 4.98 6.65 2021/5/31 4.71 4.99 6.79 2021/6/1 4.71 4.95 6.8 2021/6/2 4.79 4.93 6.79 2021/6/3 4.91 4.9 6.76 2021/6/4 4.87 4.88 6.87 2021/6/7 4.78 4.9 6.94 2021/6/8 4.84 5.02 7.06 2021/6/9 4.81 5.12 7.07 2021/6/10 4.77 5.15 6.99 2021/6/11 4.71 5.13 6.87 2021/6/15 4.72 5.08 6.88 2021/6/16 4.72 4.92 6.93 2021/6/17 4.71 4.99 7.09 2021/6/18 4.85 5.05 6.93 2021/6/21 4.67 4.98 6.91 2021/6/22 4.73 4.98 6.86 2021/6/23 4.72 5.02 6.81 "a. (5 marks) Design an Excel financial model that can help to evaluate this investment plan. Marks will be allocated for the presentation and clarity of your model (e.g., if there are clear headings, clear arrangement for input cells, appropriate use of colors, have some degree of flexibility, generate warning messages for wrong user inputs, etc.). The Excel financial model should enable you to consider the investment plan and answer the following questions: b. (3 marks) For each stock, show the daily stock returns. c. (3 marks) Based on the responses in part (b), calculate the average daily stock returns and standard deviation for each stock. d. (2 marks) Calculate the correlation of daily stock returns between each pair of stocks. e. (4 marks) Suppose that you invest 20% in Singapore Airlines Limited, 50% in Qantas Airways Limited and 30% in Cathay Pacific Airlines. Calculate the portfolio expected return, variance and standard deviation. f. (4 marks) How does the expected return and standard deviation change if you decide to invest 30% in Singapore Airlines Limited, 60% in Qantas Airways Limited, and 10% in Cathay Pacific Airlines? Explain your answers. g. (5 marks) Find the weights of Singapore Airlines Limited, Qantas Airways Limited and Cathay Pacific Airlines that will provide a daily return of 0.01% with the lowest level of risk. h. (5 marks) Plot a scatter diagram showing the portfolios from parts (e), (f) and (g), with the X-axis displaying standard deviation and the Y-axis displaying daily returns. i. (4 marks) If the daily risk-free rate is 0.1%, estimate the Sharpe ratio for the portfolios mentioned in parts (e), (f) and (g) and highlight the highest Sharpe ratio using conditional formatting. "
Step by Step Solution
There are 3 Steps involved in it
Step: 1

Get Instant Access to Expert-Tailored Solutions
See step-by-step solutions with expert insights and AI powered tools for academic success
Step: 2

Step: 3
Ace Your Homework with AI
Get the answers you need in no time with our AI-driven, step-by-step assistance
Get Started
Pivotal Decade How The United States Traded Factories For Finance In The Seventies
Authors: Judith Stein
1st Edition
0300171501, 978-0300171501