Answered step by step
Verified Expert Solution
Question
1 Approved Answer
The answer should be a very large number like the temperature of the sun that might not make much sense but that should be the
The answer should be a very large number like the temperature of the sun that might not make much sense but that should be the correct answer.
if you still cannot see the screenshot, below is a link to the shared google drive file.
https://drive.google.com/file/d/1yJE-kmq4rZ5zxjqkGTge61amI88sPf_m/view?usp=drivesdk
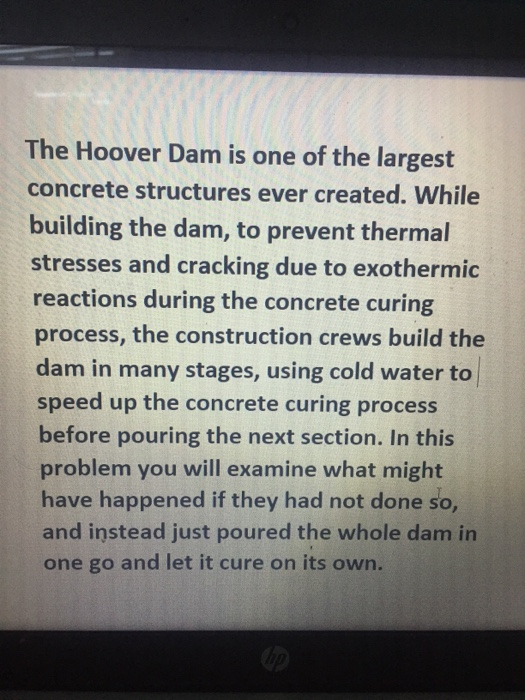
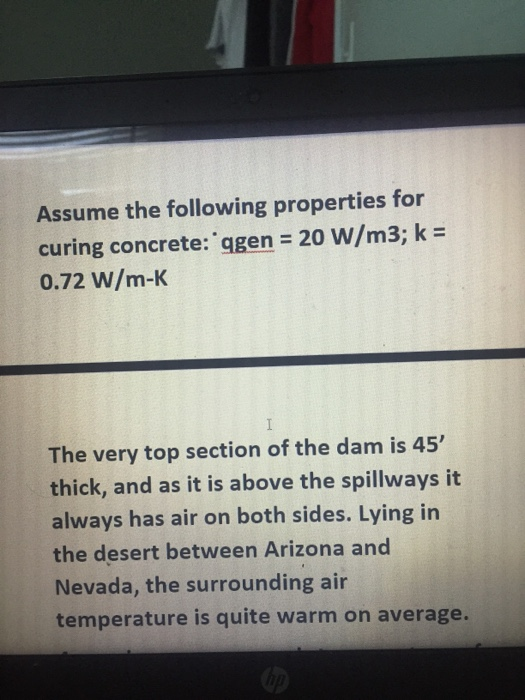
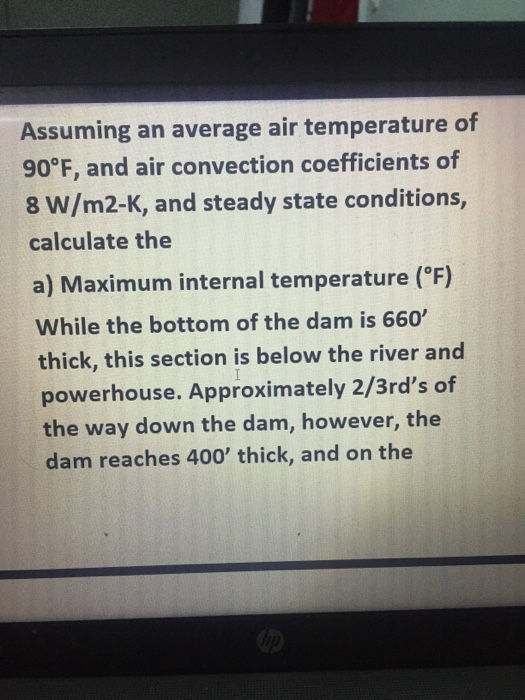
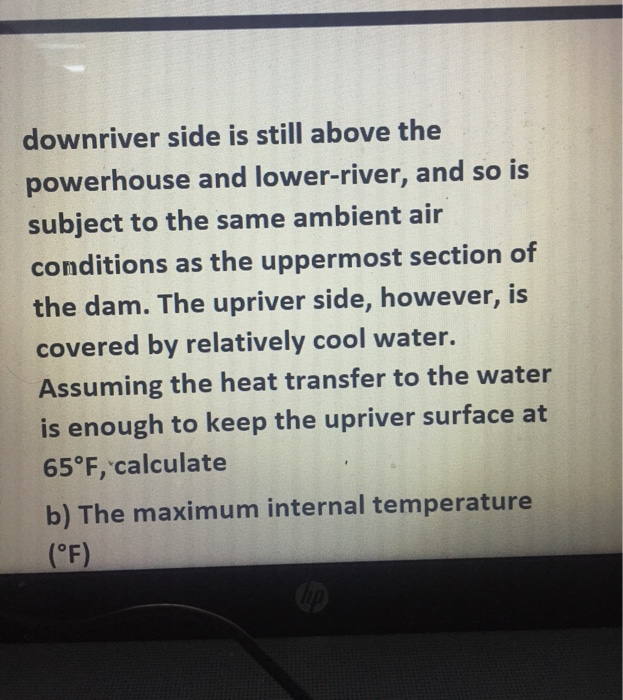
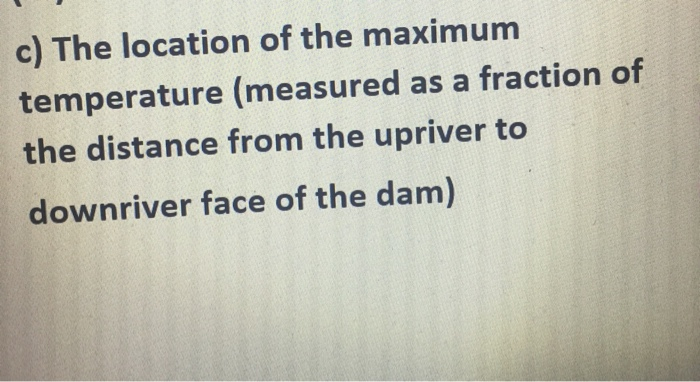
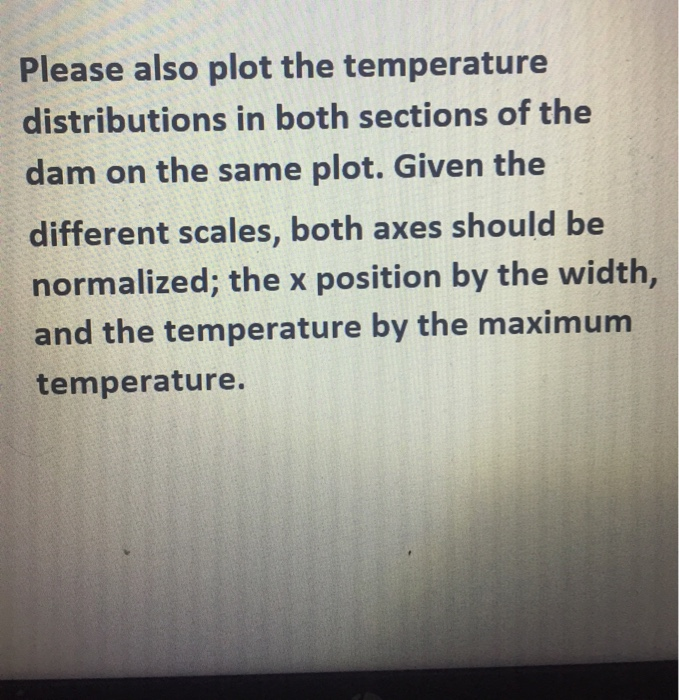
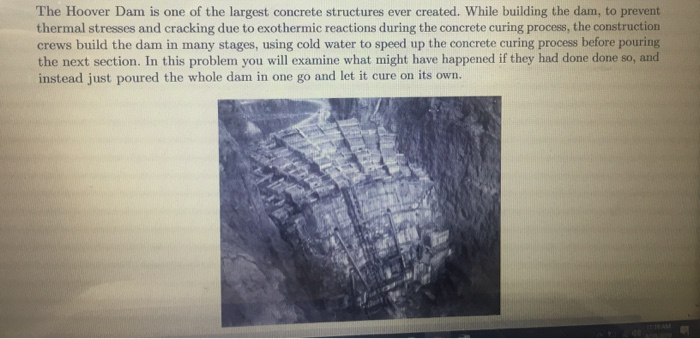
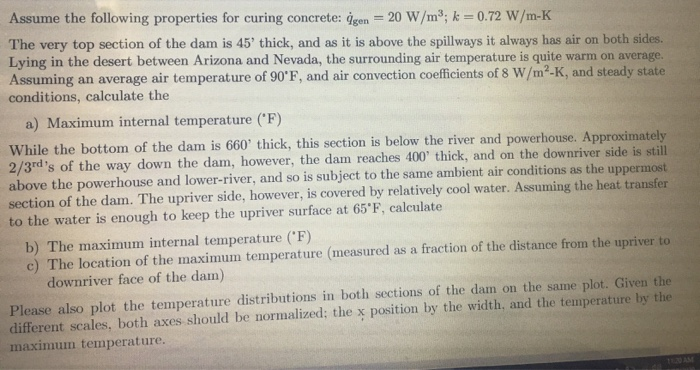
The Hoover Dam is one of the largest concrete structures ever created. While building the dam, to prevent thermal stresses and cracking due to exothermic reactions during the concrete curing process, the construction crews build the dam in many stages, using cold water to speed up the concrete curing process before pouring the next section. In this problem you will examine what might have happened if they had done done so, and instead just poured the whole dam in one go and let it cure on its own. Assume the following properties for curing concrete: igen = 20 W/m; k = 0.72 W/m-K The very top section of the dam is 45 thick, and as it is above the spillways it always has air on both sides. Lying in the desert between Arizona and Nevada, the surrounding air temperature is quite warm on average. Assuming an average air temperature of 90 F, and air convection coefficients of 8 W/m-K, and steady state conditions, calculate the a) Maximum internal temperature (F) While the bottom of the dam is 660 thick, this section is below the river and powerhouse. Approximately 2/3rd s of the way down the dam, however, the dam reaches 400 thick, and on the downriver side is still above the powerhouse and lower-river, and so is subject to the same ambient air conditions as the uppermost section of the dam. The upriver side, however, is covered by relatively cool water. Assuming the heat transfer to the water is enough to keep the upriver surface at 65F, calculate b) The maximum internal temperature (F) c) The location of the maximum temperature (measured as a fraction of the distance from the upriver to downriver face of the dam). Please also plot the temperature distributions in both sections of the dam on the same plot. Given the different scales, both axes should be normalized; the x position by the width, and the temperature by the maximum temperature. The Hoover Dam is one of the largest concrete structures ever created. While building the dam, to prevent thermal stresses and cracking due to exothermic reactions during the concrete curing process, the construction crews build the dam in many stages, using cold water to speed up the concrete curing process before pouring the next section. In this problem you will examine what might have happened if they had not done so, and instead just poured the whole dam in one go and let it cure on its own. Assume the following properties for curing concrete: qgen = 20 W/m3; k= 0.72 W/m-K I The very top section of the dam is 45 thick, and as it is above the spillways it always has air on both sides. Lying in the desert between Arizona and Nevada, the surrounding air temperature is quite warm on average. Assuming an average air temperature of 90F, and air convection coefficients of 8 W/m2-K, and steady state conditions, calculate the a) Maximum internal temperature (F) While the bottom of the dam is 660 thick, this section is below the river and powerhouse. Approximately 2/3rd s of the way down the dam, however, the dam reaches 400 thick, and on the downriver side is still above the powerhouse and lower-river, and so is subject to the same ambient air conditions as the uppermost section of the dam. The upriver side, however, is covered by relatively cool water. Assuming the heat transfer to the water is enough to keep the upriver surface at 65F, calculate b) The maximum internal temperature (F) c) The location of the maximum (measured as a fraction of temperature the distance from the upriver to downriver face of the dam) Please also plot the temperature distributions in both sections of the dam on the same plot. Given the different scales, both axes should be normalized; the x position by the width, and the temperature by the maximum temperature.
Step by Step Solution
★★★★★
3.38 Rating (154 Votes )
There are 3 Steps involved in it
Step: 1
The skin friction coefficient Cf for a laminar boundary ...
Get Instant Access to Expert-Tailored Solutions
See step-by-step solutions with expert insights and AI powered tools for academic success
Step: 2

Step: 3

Ace Your Homework with AI
Get the answers you need in no time with our AI-driven, step-by-step assistance
Get Started


