Answered step by step
Verified Expert Solution
Link Copied!

Question

1 Approved Answer

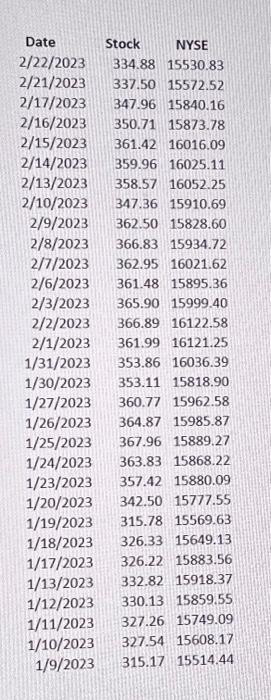
The attached Excel file contains daily stock price data for an American firm and the NYSE Composite Index. Calculate the beta for the stock over

The attached Excel file contains daily stock price data for an American firm and the NYSE Composite Index. Calculate the beta for the stock over the 30-day period. RegData-a7c7592b-b047-4e24-ab1e-9227fcd0198d.xls O 0.52 O 1.91 O 1.79 O 0.17 O 0.44
image text in transcribed
The attached Excel file contains daily stock price data for an American firm and the NYSE Composite index Cakulate the beta for the stock over the 30-day period. RegData-a7c7592b-b047.4e24-able-9227fco0.198dxds to \begin{tabular}{|} \hline 0.52 \\ \hline 1.91 \\ \hline 1.79 \\ \hline 0.17 \\ \hline 0.44 \end{tabular} \begin{tabular}{c|cc} \multicolumn{1}{l}{ Date } & Stock & NYSE \\ \hline 2/22/2023 & 334.88 & 15530.83 \\ 2/21/2023 & 337.50 & 15572.52 \\ 2/17/2023 & 347.96 & 15840.16 \\ \hline 2/16/2023 & 350.71 & 15873.78 \\ 2/15/2023 & 361.42 & 16016.09 \\ 2/14/2023 & 359.96 & 16025.11 \\ 2/13/2023 & 358.57 & 16052.25 \\ 2/10/2023 & 347.36 & 15910.69 \\ 2/9/2023 & 362.50 & 15828.60 \\ 2/8/2023 & 366.83 & 15934.72 \\ 2/7/2023 & 362.95 & 16021.62 \\ \hline/6/2023 & 361.48 & 15895.36 \\ 2/3/2023 & 365.90 & 15999.40 \\ 2/2/2023 & 366.89 & 16122.58 \\ 2/1/2023 & 361.99 & 16121.25 \\ 1/31/2023 & 353.86 & 16036.39 \\ 1/30/2023 & 353.11 & 15818.90 \\ 1/27/2023 & 360.77 & 15962.58 \\ 1/26/2023 & 364.87 & 15985.87 \\ 1/25/2023 & 367.96 & 15889.27 \\ 1/24/2023 & 363.83 & 15868.22 \\ 1/23/2023 & 357.42 & 15880.09 \\ 1/20/2023 & 342.50 & 15777.55 \\ 1/19/2023 & 315.78 & 15569.63 \\ 1/18/2023 & 326.33 & 15649.13 \\ 1/17/2023 & 326.22 & 15883.56 \\ 1/13/2023 & 332.82 & 15918.37 \\ 1/12/2023 & 330.13 & 15859.55 \\ 1/11/2023 & 327.26 & 15749.09 \\ 1/10/2023 & 327.54 & 15608.17 \\ 1/9/2023 & 315.17 & 15514.44 \\ & & \end{tabular}

Step by Step Solution

There are 3 Steps involved in it

Step: 1

blur-text-image

Get Instant Access to Expert-Tailored Solutions

See step-by-step solutions with expert insights and AI powered tools for academic success

Step: 2

blur-text-image

Step: 3

blur-text-image

Ace Your Homework with AI

Get the answers you need in no time with our AI-driven, step-by-step assistance

Get Started

Recommended Textbook for

Financial Analysis And Modeling Using Excel And VBA

Authors: Chandan Sengupta

2nd Edition

047027560X, 978-0470275603

More Books

Students also viewed these Finance questions

Question

4. What are the most common tasks addressed by NLP?

Answered: 1 week ago