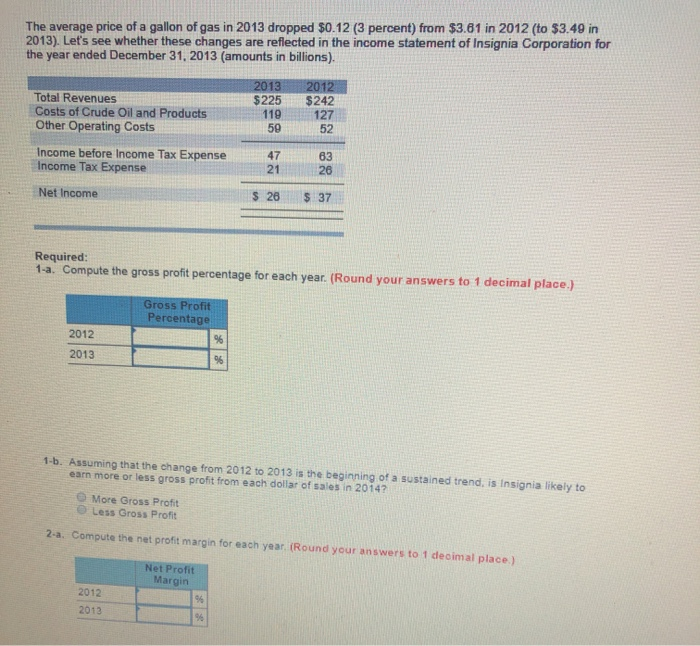
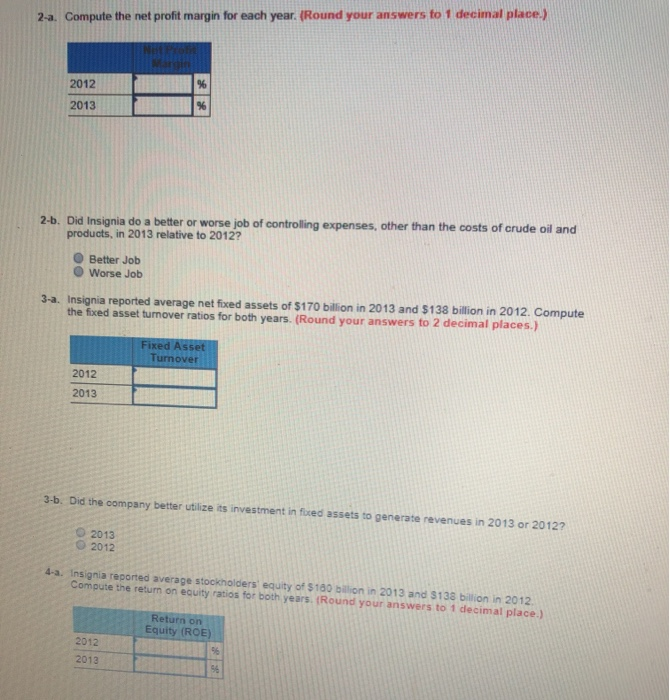
The average price of a gallon of gas in 2013 dropped $0.12 (3 percent) from $3.61 in 2012 (to $3.49 in 2013). Let's see whether these changes are reflected in the income statement of Insignia Corporation for the year ended December 31, 2013 (amounts in billions). 2013 $225 Total Revenues Costs of Crude Oil and Products Other Operating Costs 2012 $242 127 52 110 Income before Income Tax Expense Income Tax Expense 26 Net Income $ 37 Required: 1-a. Compute the gross profit percentage for each year. (Round your answers to 1 decimal place.) Gross Profit Percentage 2012 2013 1-b. Assuming that the change from 2012 to 2013 is the beginning of a sustained trend, is insignia likely to earn more or less gross profit from each dollar of sales in 2014? More Gross Profit Less Gross Profit 2-a. Compute the net profit margin for each year. (Round your answers to 1 decimal place.) Net Profit Margin 2012 2013 2-a. Compute the net profit margin for each year, (Round your answers to 1 decimal place.) NEON 2012 2013 2-b. Did Insignia do a better or worse job of controlling expenses, other than the costs of crude oil and products, in 2013 relative to 2012? Better Job Worse Job 3-a. Insignia reported average net fixed assets of $170 billion in 2013 and $138 billion in 2012. Compute the fixed asset turnover ratios for both years. (Round your answers to 2 decimal places.) Fixed Asset Turnover 2012 2013 3-b. Did the company better utilize its investment in foed assets to generate revenues in 2013 or 2012? 2013 2012 4-a. Insignia reported average stockholders' equity of $160 billion in 2013 and 138 billion in 2012 Compute the return on equity ratios for both years. Round your answers to 1 decimal place.) Return on Equity (ROE) 2012