

Answered step by step
Verified Expert Solution
Question
1 Approved Answer
The balance sheet and income statement for Clear Water Company are shown below. They represent the financials of the company for both the current year
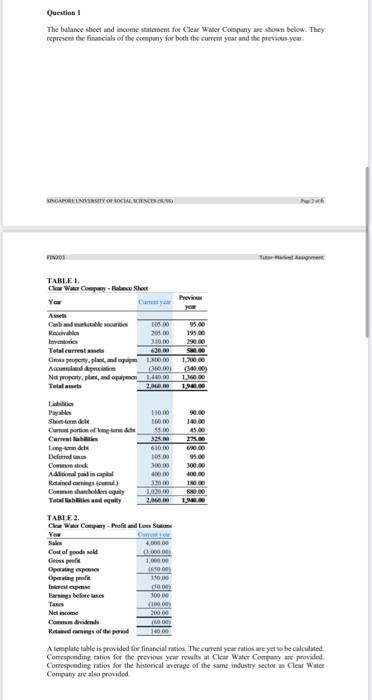
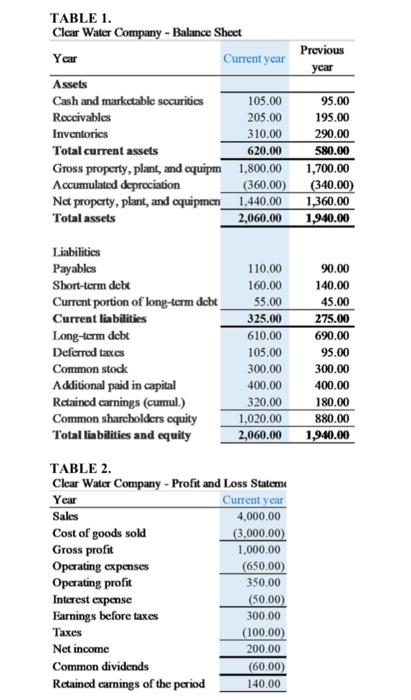
The balance sheet and income statement for Clear Water Company are shown below. They represent the financials of the company for both the current year and the previous year.
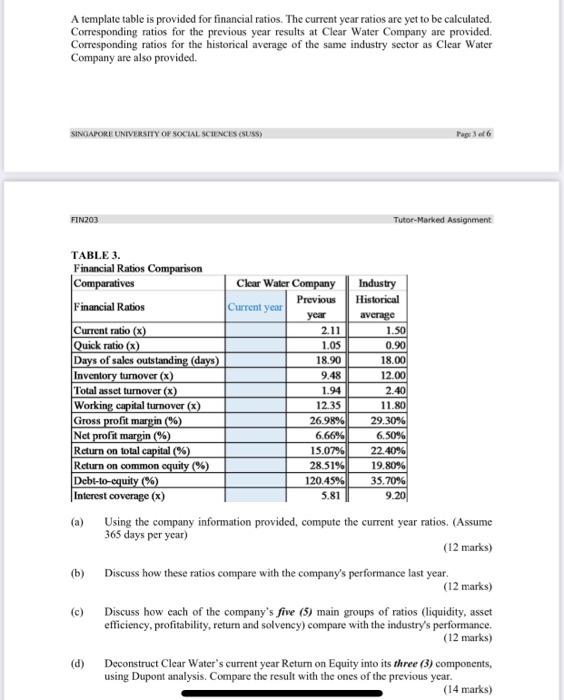
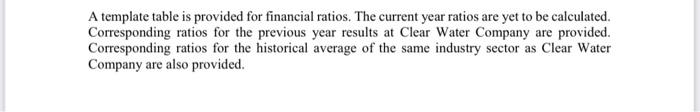
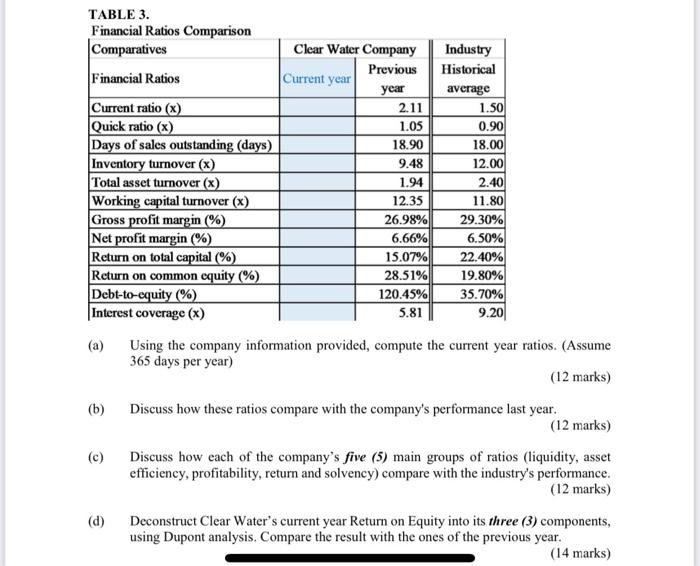
A template table is provided for financial ratios. The current year ratios are yet to be calculated. Corresponding ratios for the previous year results at Clear Water Company are provided. Corresponding ratios for the historical average of the same industry sector as Clear Water Company are also provided. SINGAPORE UNIVERSITY OF SOCIAL SCIENCES SUSSS Pepe 6 FIN203 Tutor-Marked Assignment TABLE 3. Financial Ratios Comparison Comparatives Clear Water Company Industry Previous Current year Historical Financial Ratios year average Current ratio (x) 2.11 1.50 Quick ratio (x) 1.05 0.90 Days of sales outstanding (days). 18.90 18.00 Inventory turnover (x) 9.48 12.00 Total asset turnover (x) 1.94 2.40 Working capital turnover (x) 12.35 11.80 Gross profit margin (%) 26.98% 29.30% Net profit margin (%) 6.66% 6.50% Return on total capital (%) 15.07% 22.40% Return on common equity (%) 28.51% 19.80% Debt-to-equity (%) 120.45% 35.70% Interest coverage (x) 5.81 9.20 (a) Using the company information provided, compute the current year ratios. (Assume 365 days per year) (12 marks) (b) Discuss how these ratios compare with the company's performance last year. (12 marks) (c) Discuss how cach of the company's five (5) main groups of ratios (liquidity, asset efficiency, profitability, return and solvency) compare with the industry's performance. (12 marks) (d) Deconstruct Clear Water's current year Return on Equity into its three (3) components, using Dupont analysis. Compare the result with the ones of the previous year. (14 marks) Previous year TABLE 1. Clear Water Company - Balance Sheet Year Current year Assets Cash and marketable securities 105.00 Receivables 205.00 Inventories 310.00 Total current assets 620.00 Gross property, plant, and equipm 1,800.00 Accumulated depreciation (360.00) Nat property, plant, and equipmen_1.440.00 Total assets 2,060.00 95.00 195.00 290.00 580.00 1,700.00 (340.00) 1,360.00 1,940.00 Liabilities Payables Short-term debt Current portion of long-term debt Current liabilities Long-term debt Deferred taxes Common stock Additional paid in capital Retained carnings (cumul.) Common sharcholders cquity Total liabilities and equity 110.00 160.00 55.00 325.00 610.00 105.00 300.00 400.00 320.00 1,020.00 2,060.00 90.00 140.00 45.00 275.00 690.00 95.00 300.00 400.00 180.00 880.00 1,940.00 TABLE 2. Clear Water Company - Profit and Loss Statem Year Current year Sales 4,000.00 Cost of goods sold (3.000.00) Gross profit 1.000.00 Operating expenses (650,00) Operating profit 350.00 Interest expense (50.00) Earnings before taxes 300.00 Taxes (100.00) Net income 200.00 Common dividends (60.00) Retained earnings of the period 140.00 Question 1 The balance sheet and income statement for Clear Water Company are shown below. They represent the financials of the company for both the current year and the previous year. TABLE 3. Financial Ratios Comparison Comparatives Clear Water Company Industry Previous Historical Financial Ratios Current year year average Current ratio (x) 2.11 1.50 Quick ratio (x) 1.05 0.90 Days of sales outstanding (days) 18.90 18.00 Inventory turnover (x) 9.48 12.00 Total asset turnover (x) 1.94 2.40 Working capital turnover (x) 12.35 11.80 Gross profit margin (%) 26.98% 29.30% Net profit margin (%) 6.66% 6.50% Return on total capital (%) 15.07% 22.40% Return on common equity (%) 28.51% 19.80% Debt-to-equity (%) 120.45% 35.70% Interest coverage (x) 5.81 9.20 Using the company information provided, compute the current year ratios. (Assume 365 days per year) (12 marks) (b) Discuss how these ratios compare with the company's performance last year. (12 marks) (c) Discuss how each of the company's five (5) main groups of ratios (liquidity, asset efficiency, profitability, return and solvency) compare with the industry's performance. (12 marks) (d) Deconstruct Clear Water's current year Return on Equity into its three (3) components, using Dupont analysis. Compare the result with the ones of the previous year. (14 marks) A template table is provided for financial ratios. The current year ratios are yet to be calculated. Corresponding ratios for the previous year results at Clear Water Company are provided. Corresponding ratios for the historical average of the same industry sector as Clear Water Company are also provided. SINGAPORE UNIVERSITY OF SOCIAL SCIENCES SUSSS Pepe 6 FIN203 Tutor-Marked Assignment TABLE 3. Financial Ratios Comparison Comparatives Clear Water Company Industry Previous Current year Historical Financial Ratios year average Current ratio (x) 2.11 1.50 Quick ratio (x) 1.05 0.90 Days of sales outstanding (days). 18.90 18.00 Inventory turnover (x) 9.48 12.00 Total asset turnover (x) 1.94 2.40 Working capital turnover (x) 12.35 11.80 Gross profit margin (%) 26.98% 29.30% Net profit margin (%) 6.66% 6.50% Return on total capital (%) 15.07% 22.40% Return on common equity (%) 28.51% 19.80% Debt-to-equity (%) 120.45% 35.70% Interest coverage (x) 5.81 9.20 (a) Using the company information provided, compute the current year ratios. (Assume 365 days per year) (12 marks) (b) Discuss how these ratios compare with the company's performance last year. (12 marks) (c) Discuss how cach of the company's five (5) main groups of ratios (liquidity, asset efficiency, profitability, return and solvency) compare with the industry's performance. (12 marks) (d) Deconstruct Clear Water's current year Return on Equity into its three (3) components, using Dupont analysis. Compare the result with the ones of the previous year. (14 marks) Previous year TABLE 1. Clear Water Company - Balance Sheet Year Current year Assets Cash and marketable securities 105.00 Receivables 205.00 Inventories 310.00 Total current assets 620.00 Gross property, plant, and equipm 1,800.00 Accumulated depreciation (360.00) Nat property, plant, and equipmen_1.440.00 Total assets 2,060.00 95.00 195.00 290.00 580.00 1,700.00 (340.00) 1,360.00 1,940.00 Liabilities Payables Short-term debt Current portion of long-term debt Current liabilities Long-term debt Deferred taxes Common stock Additional paid in capital Retained carnings (cumul.) Common sharcholders cquity Total liabilities and equity 110.00 160.00 55.00 325.00 610.00 105.00 300.00 400.00 320.00 1,020.00 2,060.00 90.00 140.00 45.00 275.00 690.00 95.00 300.00 400.00 180.00 880.00 1,940.00 TABLE 2. Clear Water Company - Profit and Loss Statem Year Current year Sales 4,000.00 Cost of goods sold (3.000.00) Gross profit 1.000.00 Operating expenses (650,00) Operating profit 350.00 Interest expense (50.00) Earnings before taxes 300.00 Taxes (100.00) Net income 200.00 Common dividends (60.00) Retained earnings of the period 140.00 Question 1 The balance sheet and income statement for Clear Water Company are shown below. They represent the financials of the company for both the current year and the previous year. TABLE 3. Financial Ratios Comparison Comparatives Clear Water Company Industry Previous Historical Financial Ratios Current year year average Current ratio (x) 2.11 1.50 Quick ratio (x) 1.05 0.90 Days of sales outstanding (days) 18.90 18.00 Inventory turnover (x) 9.48 12.00 Total asset turnover (x) 1.94 2.40 Working capital turnover (x) 12.35 11.80 Gross profit margin (%) 26.98% 29.30% Net profit margin (%) 6.66% 6.50% Return on total capital (%) 15.07% 22.40% Return on common equity (%) 28.51% 19.80% Debt-to-equity (%) 120.45% 35.70% Interest coverage (x) 5.81 9.20 Using the company information provided, compute the current year ratios. (Assume 365 days per year) (12 marks) (b) Discuss how these ratios compare with the company's performance last year. (12 marks) (c) Discuss how each of the company's five (5) main groups of ratios (liquidity, asset efficiency, profitability, return and solvency) compare with the industry's performance. (12 marks) (d) Deconstruct Clear Water's current year Return on Equity into its three (3) components, using Dupont analysis. Compare the result with the ones of the previous year. (14 marks) A template table is provided for financial ratios. The current year ratios are yet to be calculated. Corresponding ratios for the previous year results at Clear Water Company are provided. Corresponding ratios for the historical average of the same industry sector as Clear Water Company are also provided.
(a) Using the company information provided, compute the current year ratios. (Assume
365 days per year)
(12 marks)
(b) Discuss how these ratios compare with the company's performance last year.
(12 marks)
(c) Discuss how each of the companys five (5) main groups of ratios (liquidity, asset efficiency, profitability, return and solvency) compare with the industry's performance. (12 marks)
(d) Deconstruct Clear Waters current year Return on Equity into its three (3) components, using Dupont analysis. Compare the result with the ones of the previous year.
(14 marks)
Step by Step Solution
There are 3 Steps involved in it
Step: 1

Get Instant Access to Expert-Tailored Solutions
See step-by-step solutions with expert insights and AI powered tools for academic success
Step: 2

Step: 3
Ace Your Homework with AI
Get the answers you need in no time with our AI-driven, step-by-step assistance
Get Started
The Selected Works Of George J. Benston Banking And Financial Services Volume 1
Authors: James D. Rosenfeld
1st Edition
0195389018, 0199745471, 9780199745470