Answered step by step
Verified Expert Solution
Question
1 Approved Answer
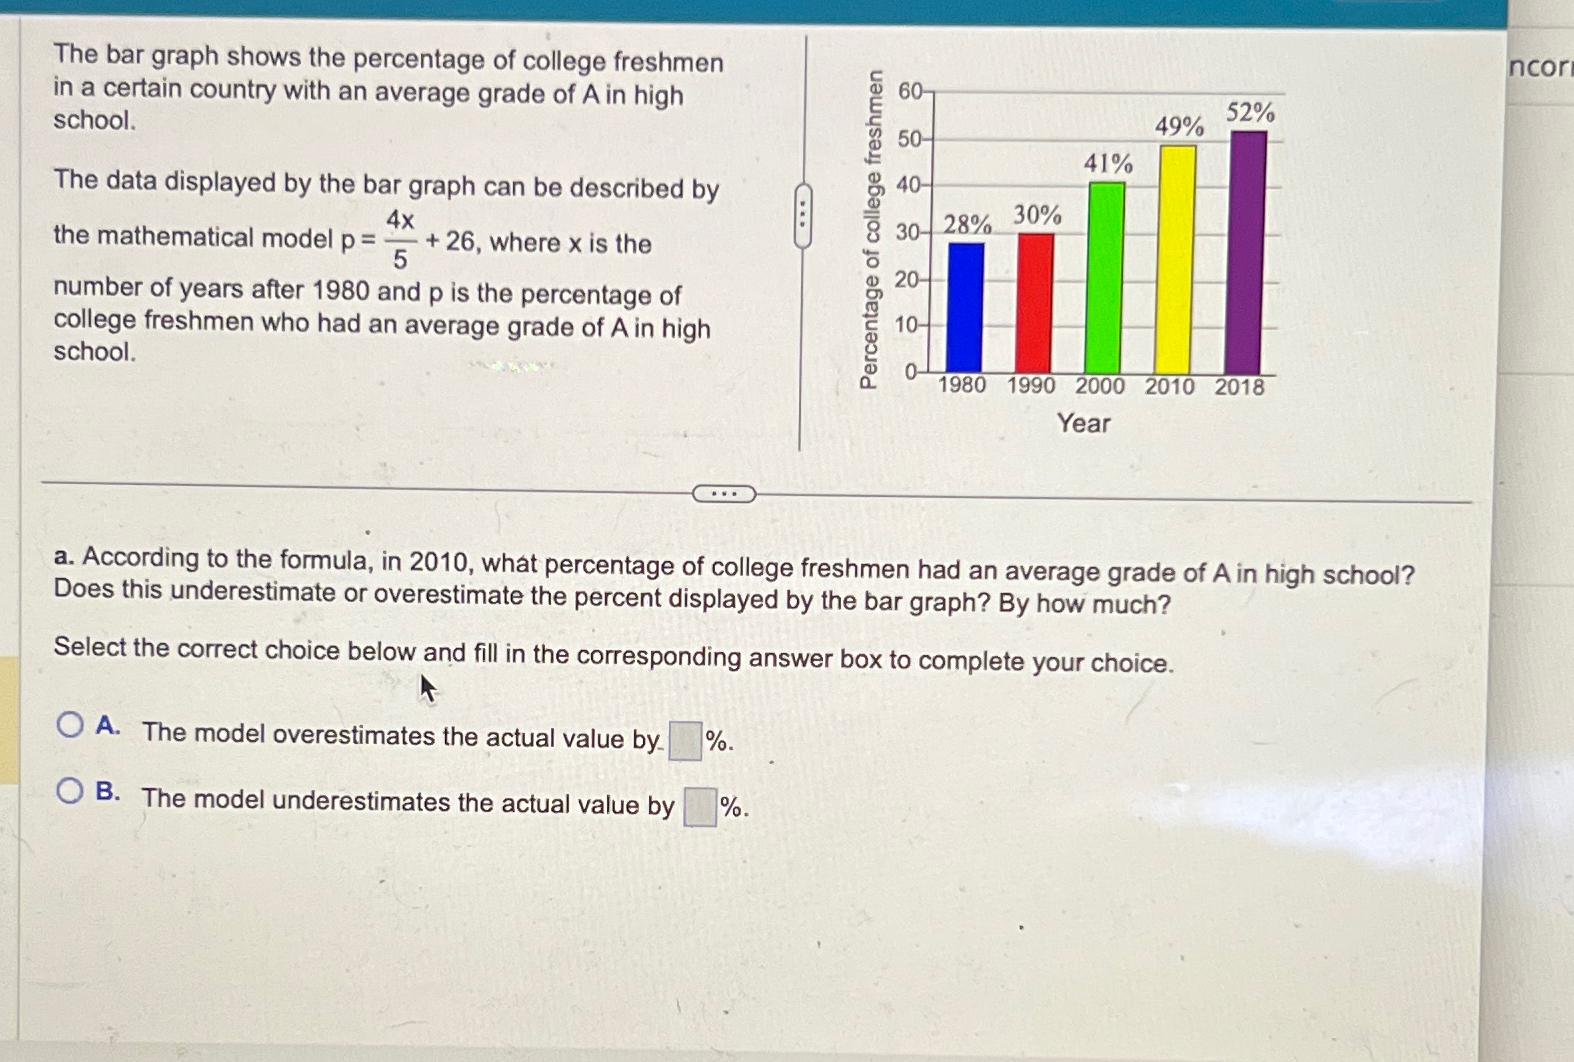
The bar graph shows the percentage of college freshmen in a certain country with an average grade of A in high school. The data displayed
The bar graph shows the percentage of college freshmen in a certain country with an average grade of A in high school.
The data displayed by the bar graph can be described by the mathematical model where is the number of years after and is the percentage of college freshmen who had an average grade of in high school.
a According to the formula, in what percentage of college freshmen had an average grade of A in high school? Does this underestimate or overestimate the percent displayed by the bar graph? By how much?
Select the correct choice below and fill in the corresponding answer box to complete your choice.
A The model overestimates the actual value by
B The model underestimates the actual value by

Step by Step Solution
There are 3 Steps involved in it
Step: 1

Get Instant Access to Expert-Tailored Solutions
See step-by-step solutions with expert insights and AI powered tools for academic success
Step: 2

Step: 3

Ace Your Homework with AI
Get the answers you need in no time with our AI-driven, step-by-step assistance
Get Started


