Answered step by step
Verified Expert Solution
Link Copied!

Question

1 Approved Answer

The below are the table and graph of the Patient Entry Time-Phased Work Packages Assigned. Redraw the table and graph and interpret the table and

The below are the table and graph of the"Patient Entry Time-Phased Work Packages Assigned".

Redraw the table and graph and interpret the table and graph and describe the table and graph in detail:
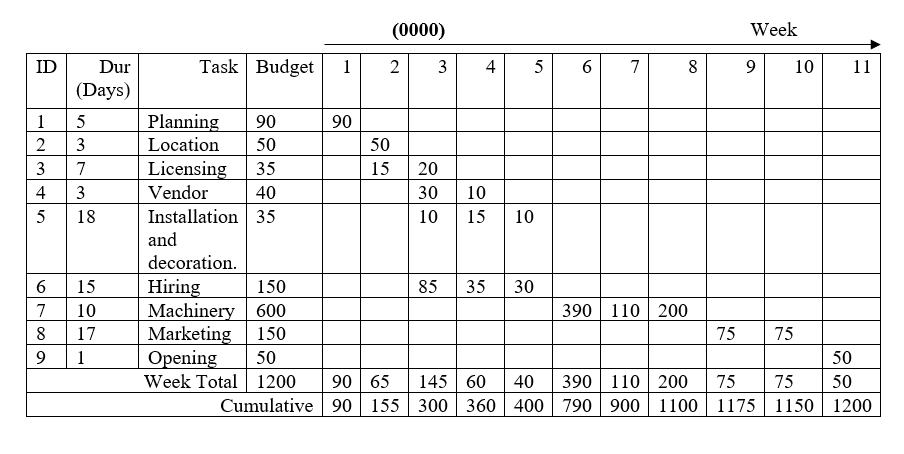
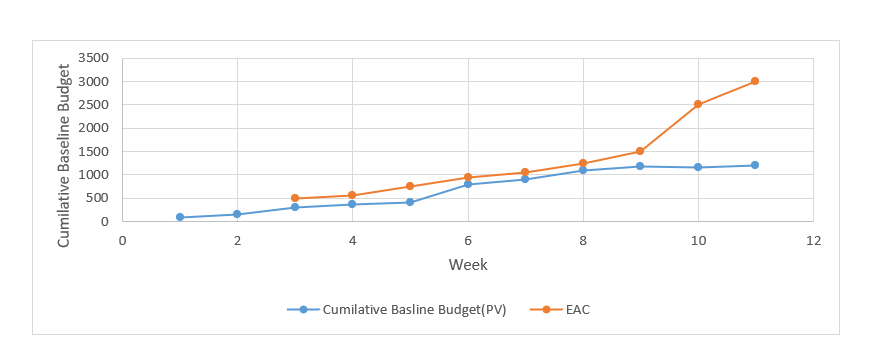
image text in transcribedimage text in transcribed
(0000) Week ID Dur Task Budget 2 3 10 11 (Days) 5 Planning 90 90 2 Location 50 50 3 7 Licensing 35 15 20 4 3 Vendor 40 30 5 18 Installation 35 10 15 10 and decoration. 6 15 Hiring 150 85 35 30 7 10 Machinery 600 390 110 200 8 17 Marketing 150 75 75 9 1 Opening 50 50 Week Total 1200 90 65 145 60 40 390 110 200 75 75 50 Cumulative 90 155 | 300 360 400 790 900 1100 1175 1150 12003500 3000 2500 2000 1500 Cumilative Baseline Budget 1000 500 0 0 2 4 6 8 10 12 Week Cumilative Basline Budget(PV) EAC

Step by Step Solution

There are 3 Steps involved in it

Step: 1

blur-text-image

Get Instant Access to Expert-Tailored Solutions

See step-by-step solutions with expert insights and AI powered tools for academic success

Step: 2

blur-text-image

Step: 3

blur-text-image

Ace Your Homework with AI

Get the answers you need in no time with our AI-driven, step-by-step assistance

Get Started

Recommended Textbook for

Small Business Management Launching & Growing Entrepreneurial Ventures

Authors: Justin Longenecker, William Petty, Leslie Palich, Frank Hoy

17th edition

9781285972565, 1133947751, 1285972562, 978-1133947752

More Books

Students also viewed these General Management questions

Question

Write a note on Historical Development of clinical Trials?

Answered: 1 week ago