Answered step by step
Verified Expert Solution
Link Copied!

Question

1 Approved Answer

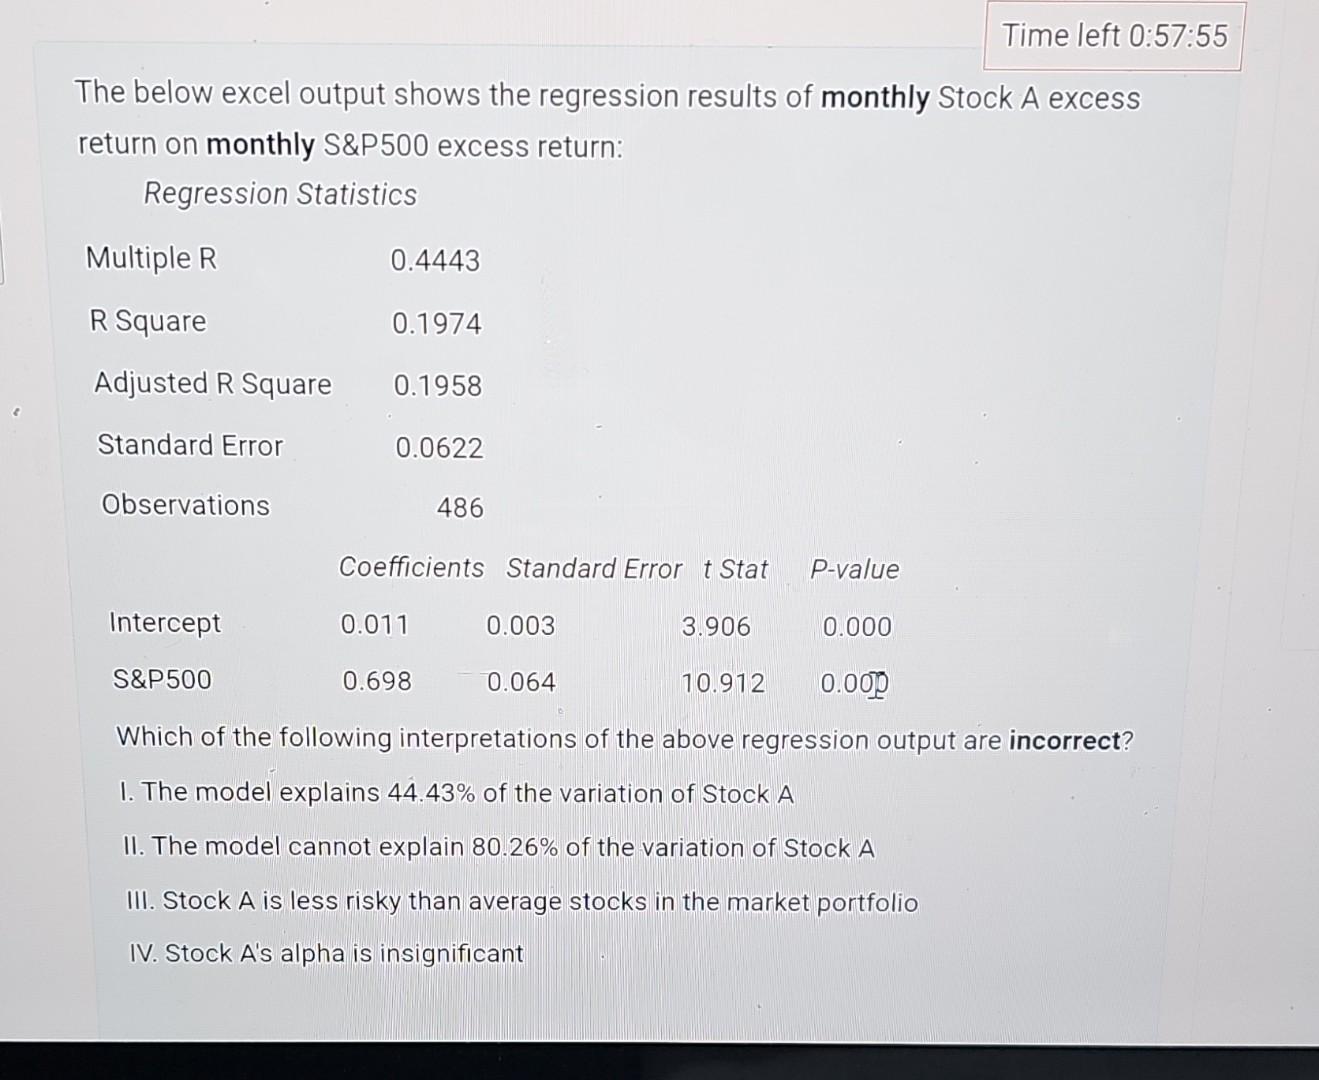
The below excel output shows the regression results of monthly Stock A excess return on monthly S&P500 excess return: Regression Statistics begin{tabular}{|c|c|c|c|c|} hline & Coefficients

image text in transcribed

The below excel output shows the regression results of monthly Stock A excess return on monthly S\&P500 excess return: Regression Statistics \begin{tabular}{|c|c|c|c|c|} \hline & Coefficients & Standard Erro & r t Stat & P-value \\ \hline Intercept & 0.011 & 0.003 & 3.906 & 0.000 \\ \hline S\&P500 & 0.698 & 0.064 & 10.912 & 0.000 \\ \hline \end{tabular} Which of the following interpretations of the above regression output are incorrect? 1. The model explains 44.43% of the variation of Stock A II. The model cannot explain 80.26% of the variation of Stock A III. Stock A is less risky than average stocks in the market portfolio IV. Stock A's alpha is insignificant

Step by Step Solution

There are 3 Steps involved in it

Step: 1

blur-text-image

Get Instant Access to Expert-Tailored Solutions

See step-by-step solutions with expert insights and AI powered tools for academic success

Step: 2

blur-text-image

Step: 3

blur-text-image

Ace Your Homework with AI

Get the answers you need in no time with our AI-driven, step-by-step assistance

Get Started

Recommended Textbook for

Financial management theory and practice

Authors: Eugene F. Brigham and Michael C. Ehrhardt

13th edition

1439078106, 111197375X, 9781439078105, 9781111973759, 978-1439078099

More Books

Students also viewed these Finance questions

Question

A phone call to a supplier to check on an overdue parts shipment

Answered: 1 week ago