

Question
The Bread Bakery bakes and sells bread. Every morning, the bakery satisfies its daily demand using bread baked before dawn. Bread is made in batches
The Bread Bakery bakes and sells bread. Every morning, the bakery satisfies its daily demand using bread baked before dawn. Bread is made in batches of 12 loaves. Each loaf costs $1.05 to make. Total daily demand occurs in dozens (or multiplies of 12 loaves). Historically, the daily demand ranges from 48 to 156 loaves per day. A loaf sells for $2.35 and any bread left at the end of the day is sold to a charity kitchen at a price of $0.35/loaf. If demand exceeds supply, there is a lost profit of $1.85/loaf (loss of profit, goodwill, and loss of customers to the competition).
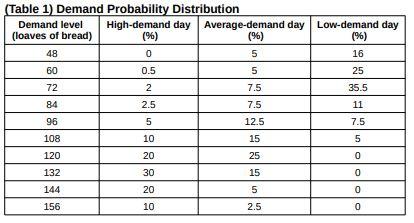
The bakery is open 7 days a week. The table below is categorized into a high, average, and low-demand day. A high-demand day happens 30% of the time, the average is 45% and the low is 25%. The table illustrates the probability that demands during high, average, and low days are of specific values (the demand probability distribution by day type)
1. Write a short python code (simulation) that will help the Bakery determine the number of loaves to bake to maximize the bakery's profit? Provide a confidence interval for the profit estimate.
Hint:
- Code should randomly generate "high", "average" or "low" demand days, based on the probabilities estimated by the Bakery.
- For a given demand day, you should randomly generate its daily demand following the probability distribution from the table. Notice that in the table, the demand probabilities for any given day-type describe a probability mass function (pmf). Using these values you would need to estimate the cumulative mass function for each day-type (cmf). Using a random number [0,1] and the cmf, you can determine a given demand level for the day-type.
- You should compute the expected profit of producing loaves at each of the ten demand levels (1st column of table)
Thank you & I will be sure to like after completed properly!
(96) Un (Table 1) Demand Probability Distribution Demand level High-demand day Average-demand day Low-demand day (loaves of bread) (%) (96) % 48 0 5 16 60 0.5 5 5 25 72 2 7.5 35.5 84 2.5 7.5 11 96 5 12.5 7.5 108 10 15 5 120 20 25 0 132 30 15 0 144 20 5 0 156 10 2.5 0 inStep by Step Solution
There are 3 Steps involved in it
Step: 1

Get Instant Access to Expert-Tailored Solutions
See step-by-step solutions with expert insights and AI powered tools for academic success
Step: 2

Step: 3
Ace Your Homework with AI
Get the answers you need in no time with our AI-driven, step-by-step assistance
Get Started
Database Design And Implementation
Authors: Edward Sciore
2nd Edition
3030338355, 978-3030338350