Answered step by step
Verified Expert Solution
Question
1 Approved Answer
The bubble point-dew curves for mixture A and B are in the image: Q1) Identify which is the bubble point and which is the dew
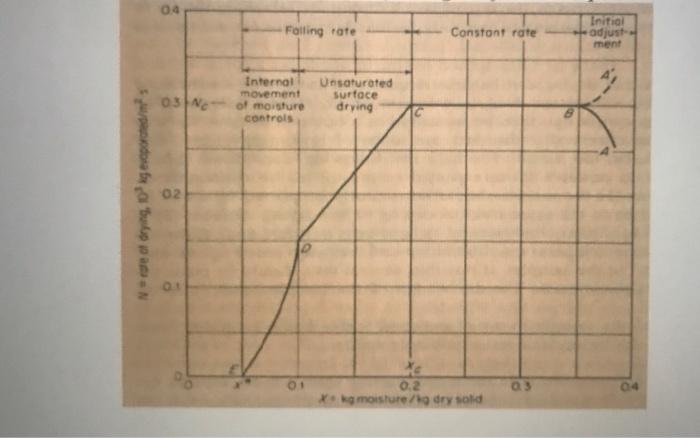
The bubble point-dew curves for mixture A and B are in the image: 
04 Falling rate Constant rate Initial adjust ment 03 Internal movement of moisture controls Unsaturated Surface drying Ndrying, og porcedes 3 02 0 0.2 * kg moisture / dry solid 
Q1) Identify which is the bubble point and which is the dew curve.
Q2) What can be said about the mixture from the given data.
Q3) From the bubble point-dew point curves given in figure 1, determine the X-Y mixture data and plot this as a curve(with given point coordinates)
Step by Step Solution
There are 3 Steps involved in it
Step: 1

Get Instant Access to Expert-Tailored Solutions
See step-by-step solutions with expert insights and AI powered tools for academic success
Step: 2

Step: 3

Ace Your Homework with AI
Get the answers you need in no time with our AI-driven, step-by-step assistance
Get Started


