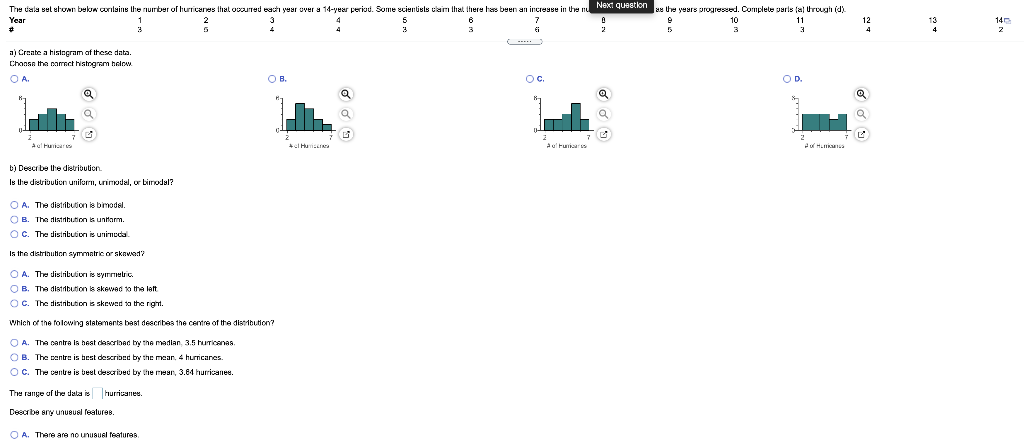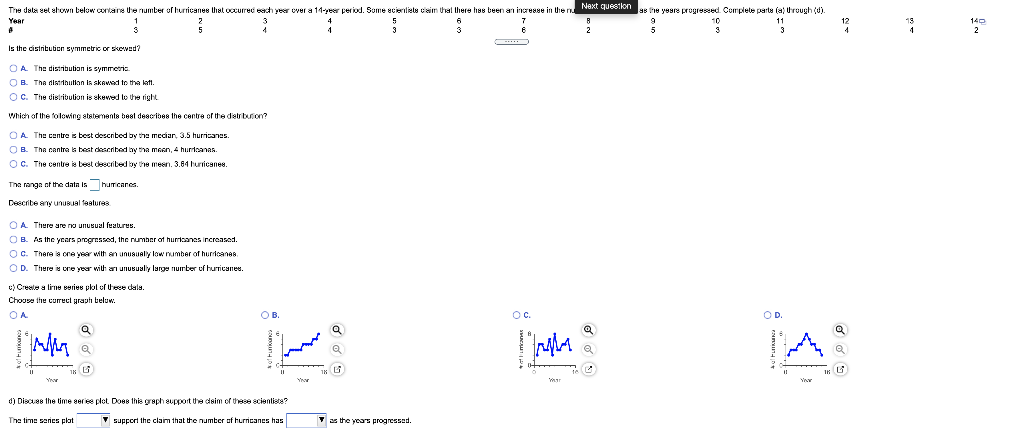

The cala sul atom boeken erilains the number of hurricanes that occurred each year over a 14-year periud. Some scientisls kain that there has been an increase in the mic Next question the years progressed. Complete parls fal Uruugi (d Year 1 7 11 12 140 3 a) Create a histogram of these data. Chansa tha namrect histogram hain OA Oc OD @ a Q Hurricanes b) Desce belle distribution Is the distribution uniformi, rimodal, or birodal? OA The distribution is bimodal. B The distribution is unilarm OC. The distribution is unimda Is the distribution symmetric or skavad? A. The distribution is wyrun B. The distribution is skewad to the latt OC. The distribution is skewed a thergh Which of the folowing statements best describes the carrine of the distribution? A. The santra la hest described by the madlan, 3.5 hutan OB. The centre is best described by the mean. 4 hurricanes OC. The entire is beal described by the mean, 3.84 hurricanes The range of the data is hurricanes Deed be any unusual features. A. There are no unusual features The data set elow below contare le number of hurricanes that occurred wherever a 11-year period. Some acier les caim that there has been an increase in Wien Next question 8the years progres Complete parts la trough (0) YAA S 6 12 13 140 2 Is the cistitution symmetric or skoved? O A The distribution is symeris B. The distribution lasked to the latt OC. The distribution is skewed to the right Which of the folowing statements beal describes the centre of the debbon? O A The centre is best described by the meciar, 3.5 hurricanes OB. The contre la best described by the moon, 4 hurricanes OC. The centre le beet described by the mean. 3.64 hurricanes. The range of the data is humicance. Deecribe any unusual features O A There are no unusual futurus. O B. As the years progressed, the number of hurricanes increased OC. There is one year with an unusualy low rumber of hurricanes OD. There is one year with an unusually large number of hurricanes. c) Create a line series plul ure dals. Choose the currect graph beluw. OA Q OB Oc a Q rolling G Y c) Discuss the time serie plet Does this graph support the daim of the scientista? The time sarcs plat support the claim that the number of hurricanes has the years progressed. The cala sul atom boeken erilains the number of hurricanes that occurred each year over a 14-year periud. Some scientisls kain that there has been an increase in the mic Next question the years progressed. Complete parls fal Uruugi (d Year 1 7 11 12 140 3 a) Create a histogram of these data. Chansa tha namrect histogram hain OA Oc OD @ a Q Hurricanes b) Desce belle distribution Is the distribution uniformi, rimodal, or birodal? OA The distribution is bimodal. B The distribution is unilarm OC. The distribution is unimda Is the distribution symmetric or skavad? A. The distribution is wyrun B. The distribution is skewad to the latt OC. The distribution is skewed a thergh Which of the folowing statements best describes the carrine of the distribution? A. The santra la hest described by the madlan, 3.5 hutan OB. The centre is best described by the mean. 4 hurricanes OC. The entire is beal described by the mean, 3.84 hurricanes The range of the data is hurricanes Deed be any unusual features. A. There are no unusual features The data set elow below contare le number of hurricanes that occurred wherever a 11-year period. Some acier les caim that there has been an increase in Wien Next question 8the years progres Complete parts la trough (0) YAA S 6 12 13 140 2 Is the cistitution symmetric or skoved? O A The distribution is symeris B. The distribution lasked to the latt OC. The distribution is skewed to the right Which of the folowing statements beal describes the centre of the debbon? O A The centre is best described by the meciar, 3.5 hurricanes OB. The contre la best described by the moon, 4 hurricanes OC. The centre le beet described by the mean. 3.64 hurricanes. The range of the data is humicance. Deecribe any unusual features O A There are no unusual futurus. O B. As the years progressed, the number of hurricanes increased OC. There is one year with an unusualy low rumber of hurricanes OD. There is one year with an unusually large number of hurricanes. c) Create a line series plul ure dals. Choose the currect graph beluw. OA Q OB Oc a Q rolling G Y c) Discuss the time serie plet Does this graph support the daim of the scientista? The time sarcs plat support the claim that the number of hurricanes has the years progressed


