Answered step by step
Verified Expert Solution
Question
1 Approved Answer
The Caribou Pipeline Company projects a pattern of inflows from the investment shown in the following table. The inflows are spread over time to reflect
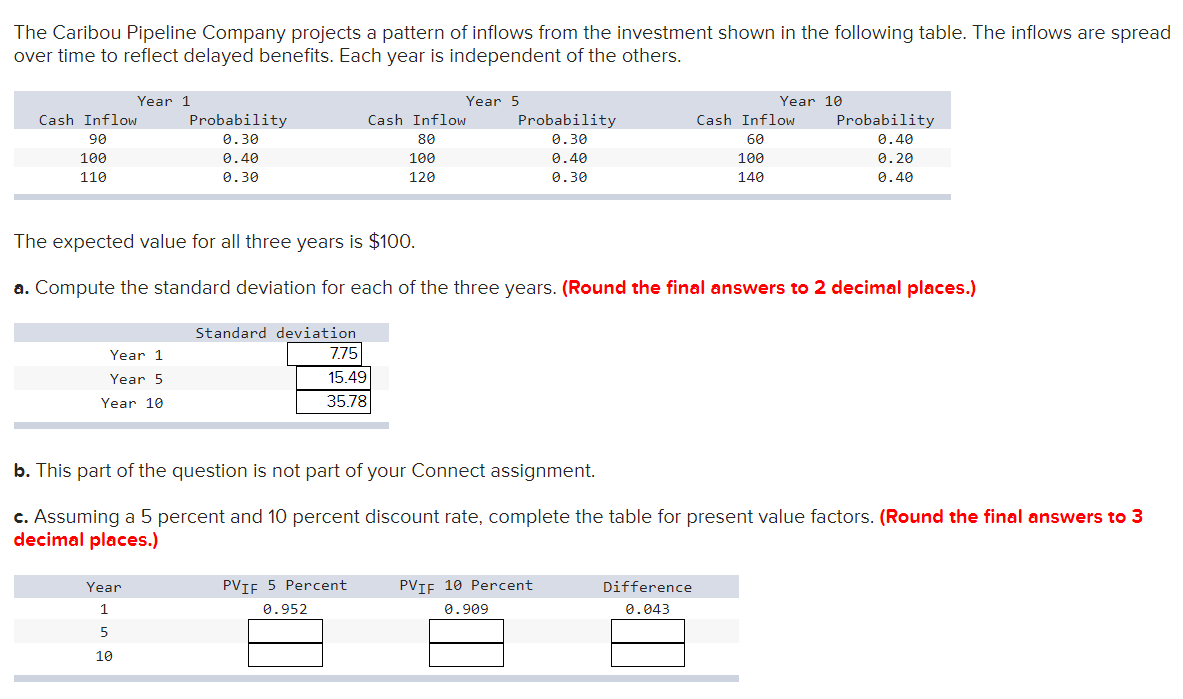
The Caribou Pipeline Company projects a pattern of inflows from the investment shown in the following table. The inflows are spread over time to reflect delayed benefits. Each year is independent of the others. Year 1 Cash Inflow Probability 90 0.30 100 0.40 0.30 Year 5 Cash Inflow Probability 80 0.30 100 0.40 120 0.30 Year 10 Cash Inflow Probability 60 0.40 100 0.20 140 0.40 110 The expected value for all three years is $100. a. Compute the standard deviation for each of the three years. (Round the final answers to 2 decimal places.) Standard deviation Year 1 Year 5 7.75 15.49 Year 10 35.78 b. This part of the question is not part of your Connect assignment. c. Assuming a 5 percent and 10 percent discount rate, complete the table for present value factors. (Round the final answers to 3 decimal places.) Year PVIF 5 Percent 0.952 PVIF 10 Percent 0.909 Difference 0.043 1 5 10 d. This part of the question is not part of your Connect assignment. e-1. Assume the initial investment is $185. What is the net present value of the expected values of $100 for the investment at a 10 percent discount rate?(Round "PV Factor" to 3 decimal places. Negative answer should be indicated by a minus sign. Do not round intermediate calculations. Round the final answer to 1 decimal place.) Net present value $ e-2. Should the investment be accepted? O Yes
Step by Step Solution
There are 3 Steps involved in it
Step: 1
Get Instant Access to Expert-Tailored Solutions
See step-by-step solutions with expert insights and AI powered tools for academic success
Step: 2
Step: 3
Ace Your Homework with AI
Get the answers you need in no time with our AI-driven, step-by-step assistance
Get Started