

Question: The characteristics of a hydrogel-based pH sensor is given in table below. The output resolution of this sensor is 0.005 mV. Input (ph) Vo
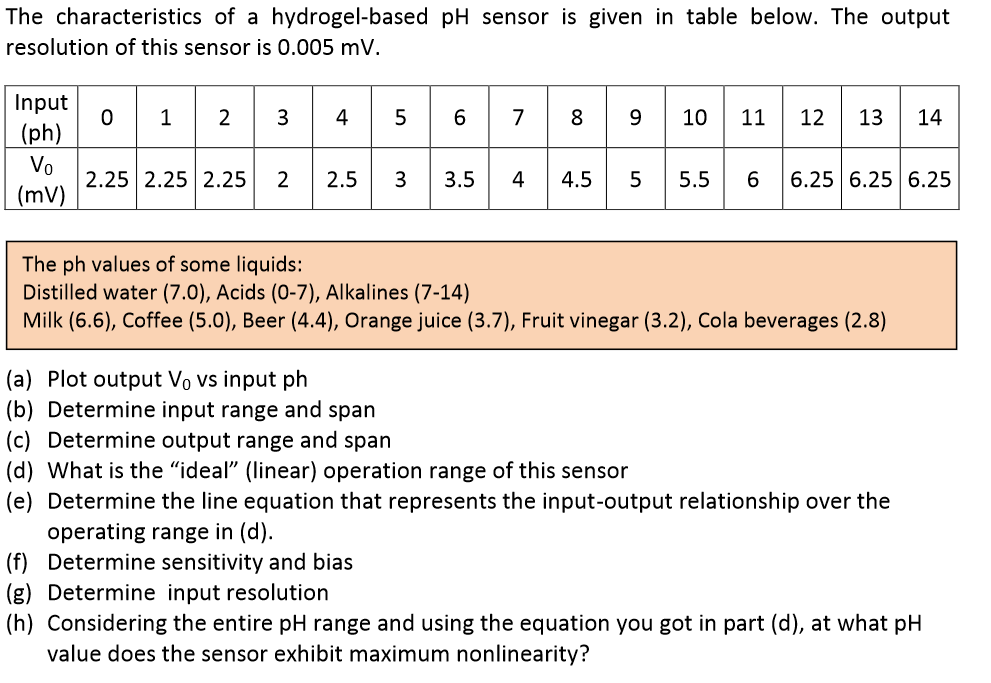
The characteristics of a hydrogel-based pH sensor is given in table below. The output resolution of this sensor is 0.005 mV. Input (ph) Vo (mV) 0 2.25 2.25 2.25 2 2.5 6 7 3 3.5 4 8 9 9 4.5 10 11 12 13 14 5 5.5 6 6.25 6.25 6.25 The ph values of some liquids: Distilled water (7.0), Acids (0-7), Alkalines (7-14) Milk (6.6), Coffee (5.0), Beer (4.4), Orange juice (3.7), Fruit vinegar (3.2), Cola beverages (2.8) (a) Plot output V vs input ph (b) Determine input range and span (c) Determine output range and span (d) What is the "ideal" (linear) operation range of this sensor (e) Determine the line equation that represents the input-output relationship over the operating range in (d). (f) Determine sensitivity and bias (g) Determine input resolution (h) Considering the entire pH range and using the equation you got in part (d), at what pH value does the sensor exhibit maximum nonlinearity?
Step by Step Solution
3.50 Rating (160 Votes )
There are 3 Steps involved in it
Lets address each part of the question stepbystep a Plot Output V0 vs Input pH Plot the given data Xaxis Input pH Yaxis Output V0 in mV Data points 0 ... View full answer

Get step-by-step solutions from verified subject matter experts