Answered step by step
Verified Expert Solution
Link Copied!

Question

1 Approved Answer

The chart below describes how analyst perception of Client Co. has changed over time in terms of Buy, Sell and Hold ratings Overview of analyst
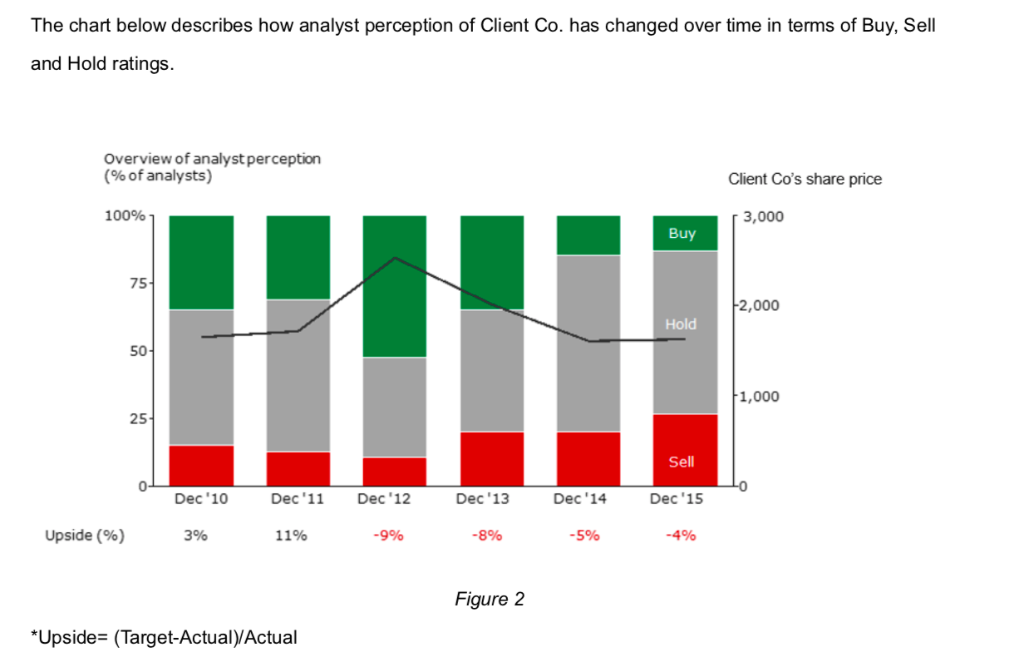
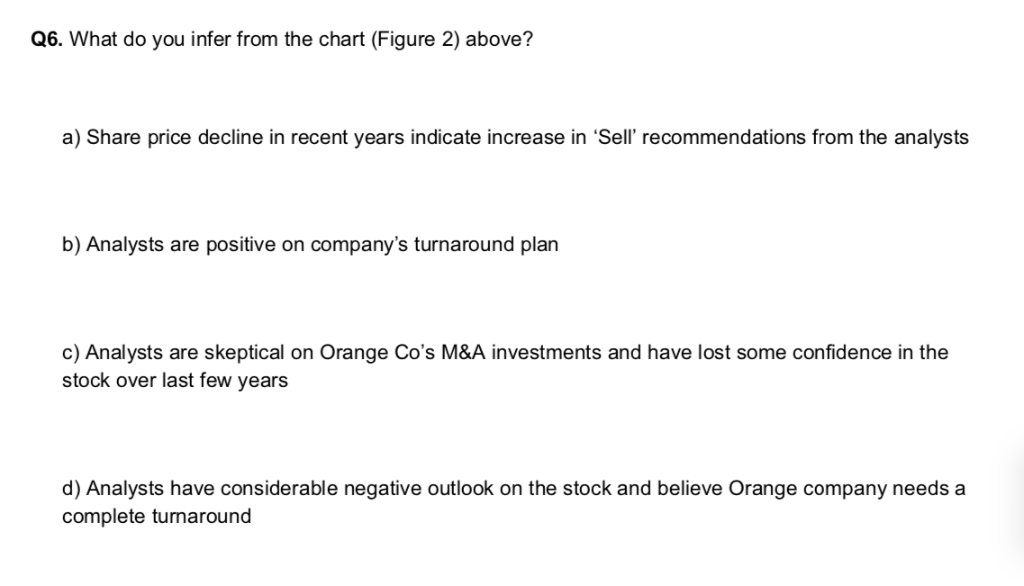
image text in transcribed

image text in transcribed

The chart below describes how analyst perception of Client Co. has changed over time in terms of Buy, Sell and Hold ratings Overview of analyst perception (% of analysts) Client Co's share price 100% 3,000 Buy 75 2,000 Hold 50 1,000 25 Sell Dec 10 Dec '11 Dec 12 Dec 13 Dec 14 Dec 15 Upside (% 11% -8 % -5% -4% 3% -9% Figure 2 *Upside- (Target-Actual)Actual Q6. What do you infer from the chart (Figure 2) above? a) Share price decline in recent years indicate increase in 'Sell' recommendations from the analysts b) Analysts are positive on company's turnaround plan c) Analysts are skeptical on Orange Co's M&A investments and have lost some confidence in the stock over last few years d) Analysts have considerable negative outlook on the stock and believe Orange company needs a complete turnaround

Step by Step Solution

There are 3 Steps involved in it

Step: 1

blur-text-image

Get Instant Access to Expert-Tailored Solutions

See step-by-step solutions with expert insights and AI powered tools for academic success

Step: 2

blur-text-image_2

Step: 3

blur-text-image_3

Ace Your Homework with AI

Get the answers you need in no time with our AI-driven, step-by-step assistance

Get Started

Recommended Textbook for

The Palgrave Macmillan Understanding Investment Funds Insights From Performance And Risk Analysis

Authors: V. Terraza , H. Razafitombo

1st Edition

1137273607,1137273615

More Books

Students also viewed these Finance questions