Answered step by step
Verified Expert Solution
Link Copied!

Question

1 Approved Answer

The chemical activity in each phase was measured, as summarized in the table below. XB T(C) 300 an 0.02 0.05 0.10 0.02 0.05 0.10 ag
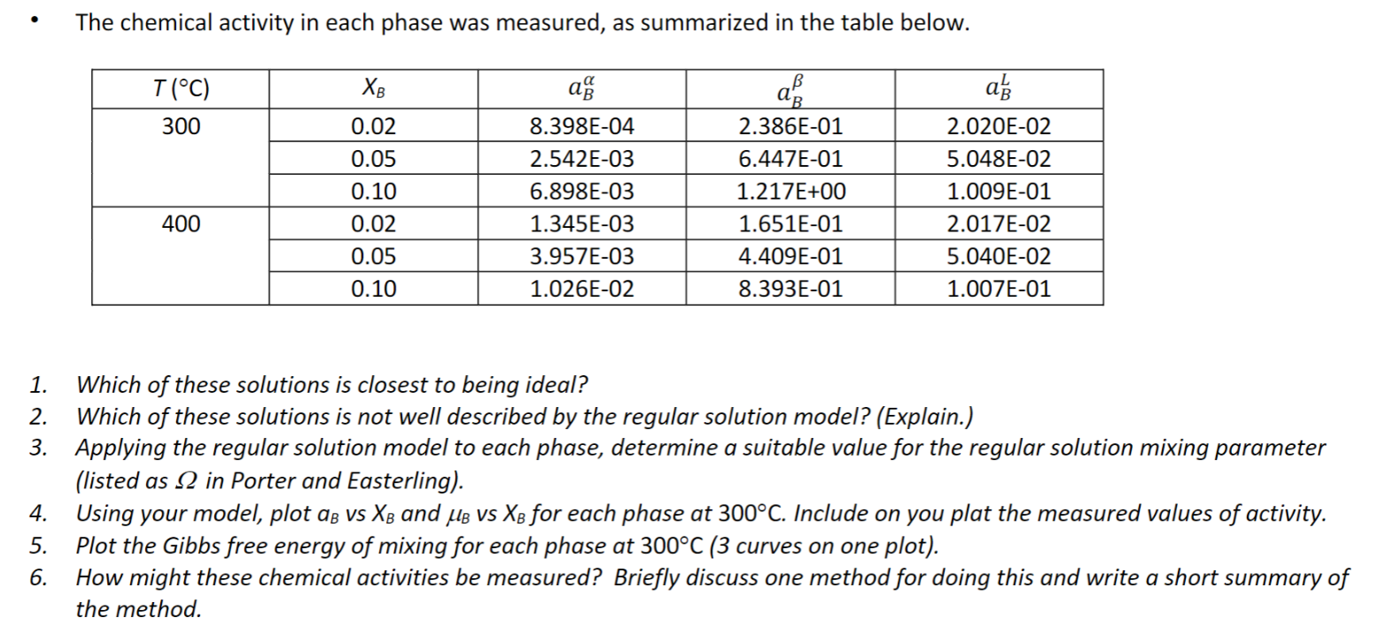
image text in transcribed

The chemical activity in each phase was measured, as summarized in the table below. XB T(C) 300 an 0.02 0.05 0.10 0.02 0.05 0.10 ag 8.398E-04 2.542E-03 6.898E-03 1.345E-03 3.957E-03 1.026E-02 2.386E-01 6.447E-01 1.217E+00 1.651E-01 4.409E-01 8.393E-01 a 2.020E-02 5.048E-02 1.009E-01 2.017E-02 5.040E-02 1.007E-01 400 1. Which of these solutions is closest to being ideal? 2. Which of these solutions is not well described by the regular solution model? (Explain.) 3. Applying the regular solution model to each phase, determine a suitable value for the regular solution mixing parameter (listed as 12 in Porter and Easterling). 4. Using your model, plot do vs Xp and up vs XB for each phase at 300C. Include on you plat the measured values of activity. 5. Plot the Gibbs free energy of mixing for each phase at 300C (3 curves on one plot). 6. How might these chemical activities be measured? Briefly discuss one method for doing this and write a short summary of the method. The chemical activity in each phase was measured, as summarized in the table below. XB T(C) 300 an 0.02 0.05 0.10 0.02 0.05 0.10 ag 8.398E-04 2.542E-03 6.898E-03 1.345E-03 3.957E-03 1.026E-02 2.386E-01 6.447E-01 1.217E+00 1.651E-01 4.409E-01 8.393E-01 a 2.020E-02 5.048E-02 1.009E-01 2.017E-02 5.040E-02 1.007E-01 400 1. Which of these solutions is closest to being ideal? 2. Which of these solutions is not well described by the regular solution model? (Explain.) 3. Applying the regular solution model to each phase, determine a suitable value for the regular solution mixing parameter (listed as 12 in Porter and Easterling). 4. Using your model, plot do vs Xp and up vs XB for each phase at 300C. Include on you plat the measured values of activity. 5. Plot the Gibbs free energy of mixing for each phase at 300C (3 curves on one plot). 6. How might these chemical activities be measured? Briefly discuss one method for doing this and write a short summary of the method

Step by Step Solution

There are 3 Steps involved in it

Step: 1

blur-text-image

Get Instant Access to Expert-Tailored Solutions

See step-by-step solutions with expert insights and AI powered tools for academic success

Step: 2

blur-text-image

Step: 3

blur-text-image

Ace Your Homework with AI

Get the answers you need in no time with our AI-driven, step-by-step assistance

Get Started

Recommended Textbook for

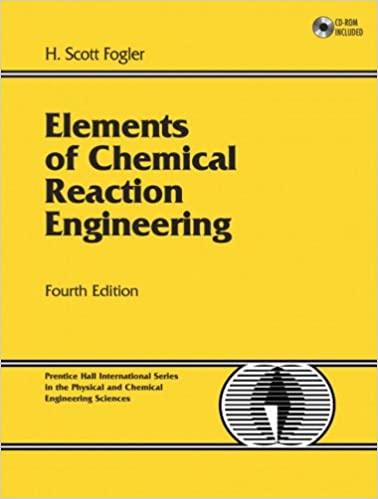
Elements Of Chemical Reaction Engineering

Authors: H. Scott Fogler

4th Edition

0130473944, 978-0130473943

More Books

Students also viewed these Chemical Engineering questions

Question

Do you have any pets?

Answered: 1 week ago

Question

The employees were represented by Janet Hogan.

Answered: 1 week ago