Question
The company has a cost of capital that ranges from: Rate Project risk 8% low 10% average 13% high risk The coefficient of variation NPV
The company has a cost of capital that ranges from:
Rate Project risk
8% low
10% average
13% high risk
The coefficient of variation NPV for the Average risk project is between .8 and 1.2
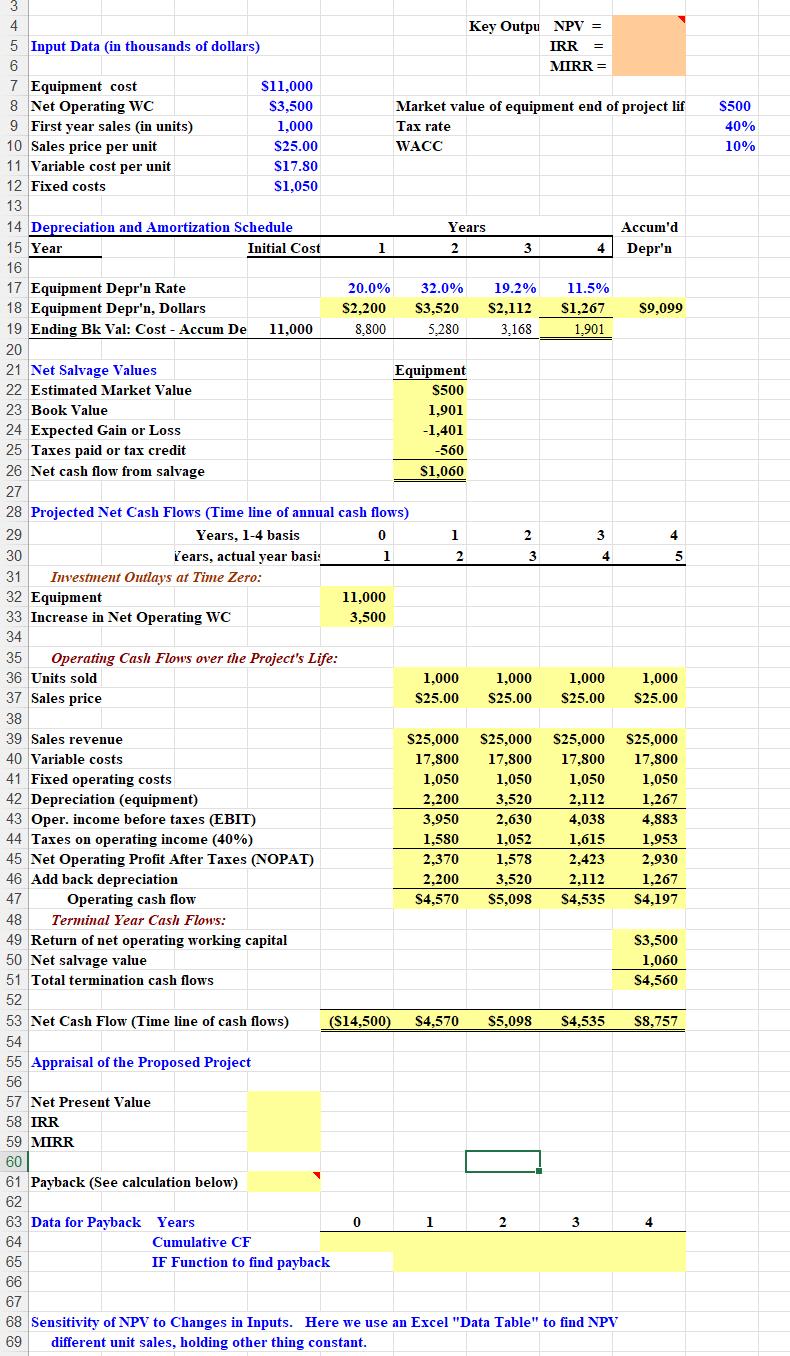
Create a spreadsheet and use it to find the project’s NPV, IRR, and payback. Your spreadsheet should have the following sections: Input Data (in thousands of dollars), Depreciation and Amortization Schedule, Net Salvage Values, Projected Net Cash Flows (Timeline of annual cash flows), Appraisal of the Proposed Project (NPV, IRR, MIRR, Payback (using if statement). Using Excel’s “Data Table” Examine the sensitivity of NPV to changes in inputs (sales, WACC, variable costs, fixed costs, sales price). Graph the results.

3 4 5 Input Data (in thousands of dollars) 6 7 Equipment cost 8 Net Operating WC 9 First year sales (in units) 10 Sales price per unit 11 Variable cost per unit 12 Fixed costs 13 14 Depreciation and Amortization Schedule 15 Year 16 17 Equipment Depr'n Rate 18 Equipment Depr'n, Dollars 19 Ending Bk Val: Cost - Accum De 20 21 Net Salvage Values 22 Estimated Market Value 23 Book Value Initial Cost 35 36 Units sold 37 Sales price 38 39 Sales revenue 40 Variable costs 41 Fixed operating costs 42 Depreciation (equipment) $11,000 $3,500 1,000 $25.00 $17.80 $1,050 Years, actual year basis Investment Outlays at Time Zero: 43 Oper. income before taxes (EBIT) 44 Taxes on operating income (40%) 24 Expected Gain or Loss 25 Taxes paid or tax credit 26 Net cash flow from salvage 27 28 Projected Net Cash Flows (Time line of annual cash flows) 29 Years, 1-4 basis 0 30 31 32 Equipment 33 Increase in Net Operating WC 34 66 67 11,000 Operating Cash Flows over the Project's Life: 45 Net Operating Profit After Taxes (NOPAT) 46 Add back depreciation 47 Operating cash flow 48 Terminal Year Cash Flows: 49 Return of net operating working capital 50 Net salvage value 51 Total termination cash flows 52 55 Appraisal of the Proposed Project 56 57 Net Present Value 58 IRR 59 MIRR 60 61 Payback (See calculation below) 62 63 Data for Payback Years 64 65 53 Net Cash Flow (Time line of cash flows) 54 1 20.0% $2,200 8,800 Cumulative CF IF Function to find payback 1 11,000 3,500 0 Market value of equipment end of project lif Tax rate WACC Equipment $500 1,901 -1,401 -560 $1,060 Years 2 32.0% 19.2% $3,520 $2,112 5,280 3,168 Key Outpu NPV = IRR = MIRR = 1 2 ($14,500) $4,570 1 3 1,000 1,000 $25.00 $25.00 2 3 2 11.5% $1,267 1,901 3 4 1,000 $25.00 $5,098 $4,535 3 $25,000 $25,000 $25,000 $25,000 17,800 17,800 17,800 17,800 1,050 1,050 1,050 2,200 3,520 2,112 3,950 2,630 4,038 1,580 1,052 1,615 2,370 1,578 2,423 2,200 3,520 2,112 $4,570 $5,098 $4,535 Accum'd Depr'n 68 Sensitivity of NPV to Changes in Inputs. Here we use an Excel "Data Table" to find NPV 69 different unit sales, holding other thing constant. $9,099 4 5 1,000 $25.00 1,050 1,267 4,883 1,953 2,930 1,267 $4,197 $3,500 1,060 $4,560 4 $8,757 $500 40% 10%
Step by Step Solution
3.47 Rating (163 Votes )
There are 3 Steps involved in it
Step: 1
Answer Solution Computation of cash flows Year 0 1 2 3 4 Initial Investment Equipment cost 11000 Working capital requirement 3500 14500 Operating cash in flows Sales units 1000 1000 1000 1000 Sales pr...
Get Instant Access to Expert-Tailored Solutions
See step-by-step solutions with expert insights and AI powered tools for academic success
Step: 2

Step: 3

Ace Your Homework with AI
Get the answers you need in no time with our AI-driven, step-by-step assistance
Get Started


