Question
(the company) is being assessed by the independent ABC agency for potential acquisition. The company has provided its most recent financial statements (Balance Sheet and
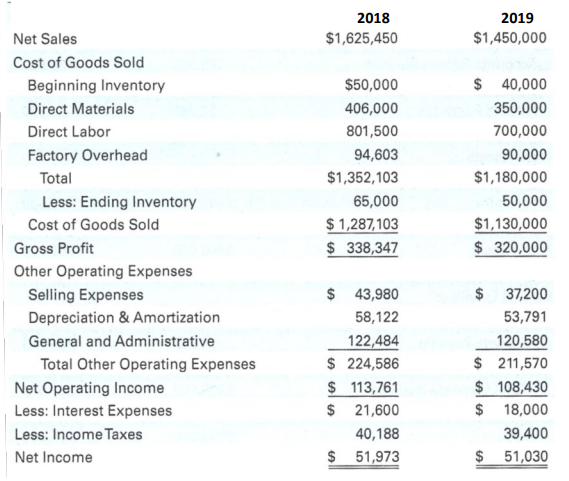
(the company) is being assessed by the independent ABC agency for potential acquisition. The company has provided its most recent financial statements (Balance Sheet and Income Statement) to the ABC agency for assessment. (i) You, an employee of the ABC assessment agency, is requested to calculate: the EBIT*, EBITDA* profitability indicators and the following six financial ratios: Current Ratio, Acid Test Ratio, Equity Ratio, Inventory-Turnover Ratio, Return-On-Assets Ratio, and Return-On-Equity Ratio, for both reported years. (ii) State and justify your recommendation based on the evaluation of the financial statements of the company, the profitability indicators and the ratios that you have determined for both given years, by comparing them against the industry standards provided below:
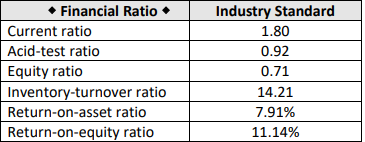
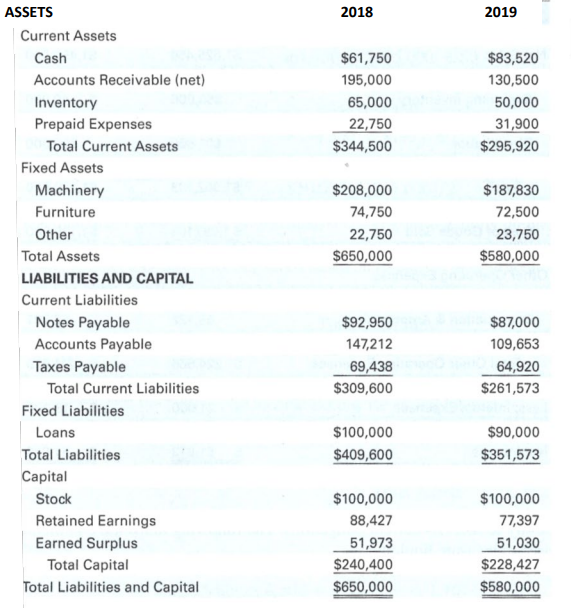
Financial Ratio Current ratio Acid-test ratio Equity ratio Inventory-turnover ratio Return-on-asset ratio Return-on-equity ratio Industry Standard 1.80 0.92 0.71 14.21 7.91% 11.14% 2018 2019 $61,750 195,000 65,000 22,750 $344,500 $83,520 130,500 50,000 31,900 $295,920 $208,000 74,750 22,750 $650,000 $187,830 72,500 23,750 $580,000 ASSETS Current Assets Cash Accounts Receivable (net) Inventory Prepaid Expenses Total Current Assets Fixed Assets Machinery Furniture Other Total Assets LIABILITIES AND CAPITAL Current Liabilities Notes Payable Accounts Payable Taxes Payable Total Current Liabilities Fixed Liabilities Loans Total Liabilities Capital Stock Retained Earnings Earned Surplus Total Capital Total Liabilities and Capital $92,950 147,212 69,438 $309,600 $87,000 109,653 64,920 $261,573 $100,000 $409,600 $90,000 $351,573 $100,000 88,427 51,973 $240,400 $650,000 $100,000 77,397 51,030 $228,427 $580,000 2018 $1,625,450 2019 $1,450,000 Net Sales Cost of Goods Sold Beginning Inventory Direct Materials Direct Labor Factory Overhead Total Less: Ending Inventory Cost of Goods Sold Gross Profit Other Operating Expenses Selling Expenses Depreciation & Amortization General and Administrative Total Other Operating Expenses Net Operating Income Less: Interest Expenses Less: Income Taxes Net Income $50,000 406,000 801,500 94,603 $1,352,103 65,000 $ 1,287,103 $ 338,347 $ 40,000 350,000 700,000 90,000 $1,180,000 50,000 $1,130,000 $ 320,000 $ 43,980 58,122 122,484 $ 224,586 $ 113,761 $ 21,600 40,188 $ 51,973 $ 37,200 53,791 120,580 $ 211,570 $ 108,430 $ 18,000 39,400 $ 51,030Step by Step Solution
There are 3 Steps involved in it
Step: 1
Get Instant Access to Expert-Tailored Solutions
See step-by-step solutions with expert insights and AI powered tools for academic success
Step: 2
Step: 3
Ace Your Homework with AI
Get the answers you need in no time with our AI-driven, step-by-step assistance
Get Started