Answered step by step
Verified Expert Solution
Question
1 Approved Answer
The company reports sales made by each sales consultant on a quarterly basis. The extract from sales for current FY is below. 1. Create a
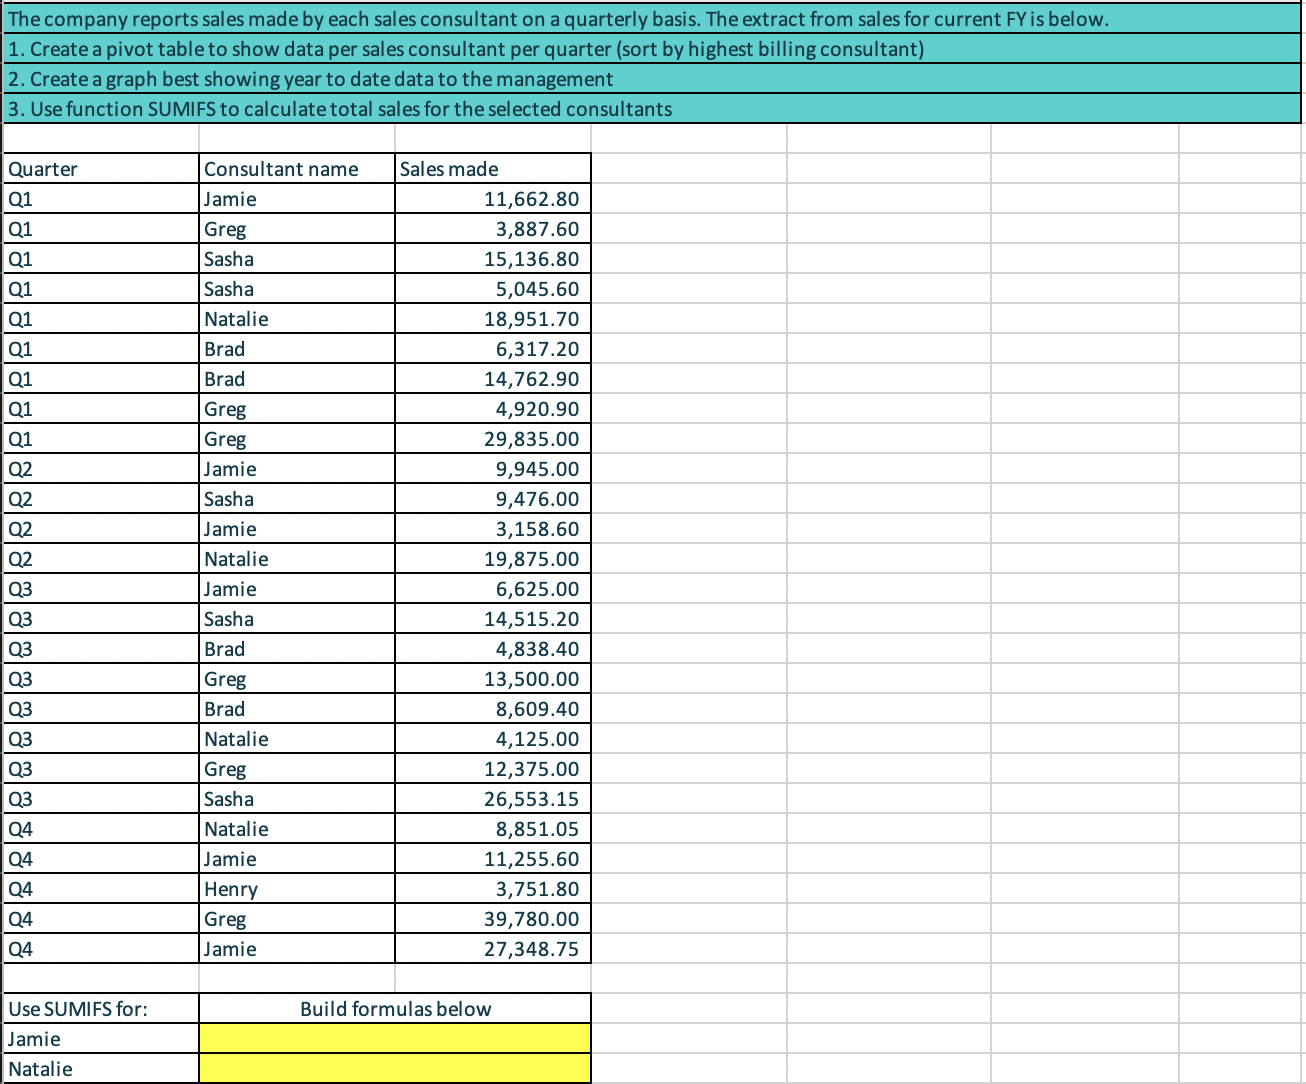
 The company reports sales made by each sales consultant on a quarterly basis. The extract from sales for current FY is below. 1. Create a pivot table to show data per sales consultant per quarter (sort by highest billing consultant) 2. Create a graph best showing year to date data to the management 3. Use function SUMIFS to calculate total sales for the selected consultants \begin{tabular}{|l|l|r|} \hline Quarter & Consultant name & Sales made \\ \hline Q1 & Jamie & 11,662.80 \\ \hline Q1 & Greg & 3,887.60 \\ \hline Q1 & Sasha & 15,136.80 \\ \hline Q1 & Sasha & 5,045.60 \\ \hline Q1 & Natalie & 18,951.70 \\ \hline Q1 & Brad & 6,317.20 \\ \hline Q1 & Brad & 14,762.90 \\ \hline Q1 & Greg & 4,920.90 \\ \hline Q1 & Greg & 29,835.00 \\ \hline Q2 & Jamie & 9,945.00 \\ \hline Q2 & Sasha & 9,476.00 \\ \hline Q2 & Jamie & 3,158.60 \\ \hline Q2 & Natalie & 19,875.00 \\ \hline Q3 & Jamie & 6,625.00 \\ \hline Q3 & Sasha & 14,515.20 \\ \hline Q3 & Brad & 4,838.40 \\ \hline Q3 & Greg & 13,500.00 \\ \hline Q3 & Brad & 8,609.40 \\ \hline Q3 & Natalie & 4,125.00 \\ \hline Q3 & Greg & 12,375.00 \\ \hline Q3 & Sasha & 26,553.15 \\ \hline Q4 & Natalie & 8,851.05 \\ \hline Q4 & Jamie & 11,255.60 \\ \hline Q4 & Henry & 3,751.80 \\ \hline Q4 & Jamie & 27,348.75 \\ \hline Q4 & & \\ \hline & & \\ \hline \end{tabular} \begin{tabular}{|l|c|} \hline Use SUMIFS for: & Build formulas below \\ \hline Jamie & \\ \hline Natalie & \\ \hline \end{tabular}
 Step by Step Solution
There are 3 Steps involved in it
Step: 1

Get Instant Access to Expert-Tailored Solutions
See step-by-step solutions with expert insights and AI powered tools for academic success
Step: 2

Step: 3

Ace Your Homework with AI
Get the answers you need in no time with our AI-driven, step-by-step assistance
Get Started


