

Answered step by step
Verified Expert Solution
Question
1 Approved Answer
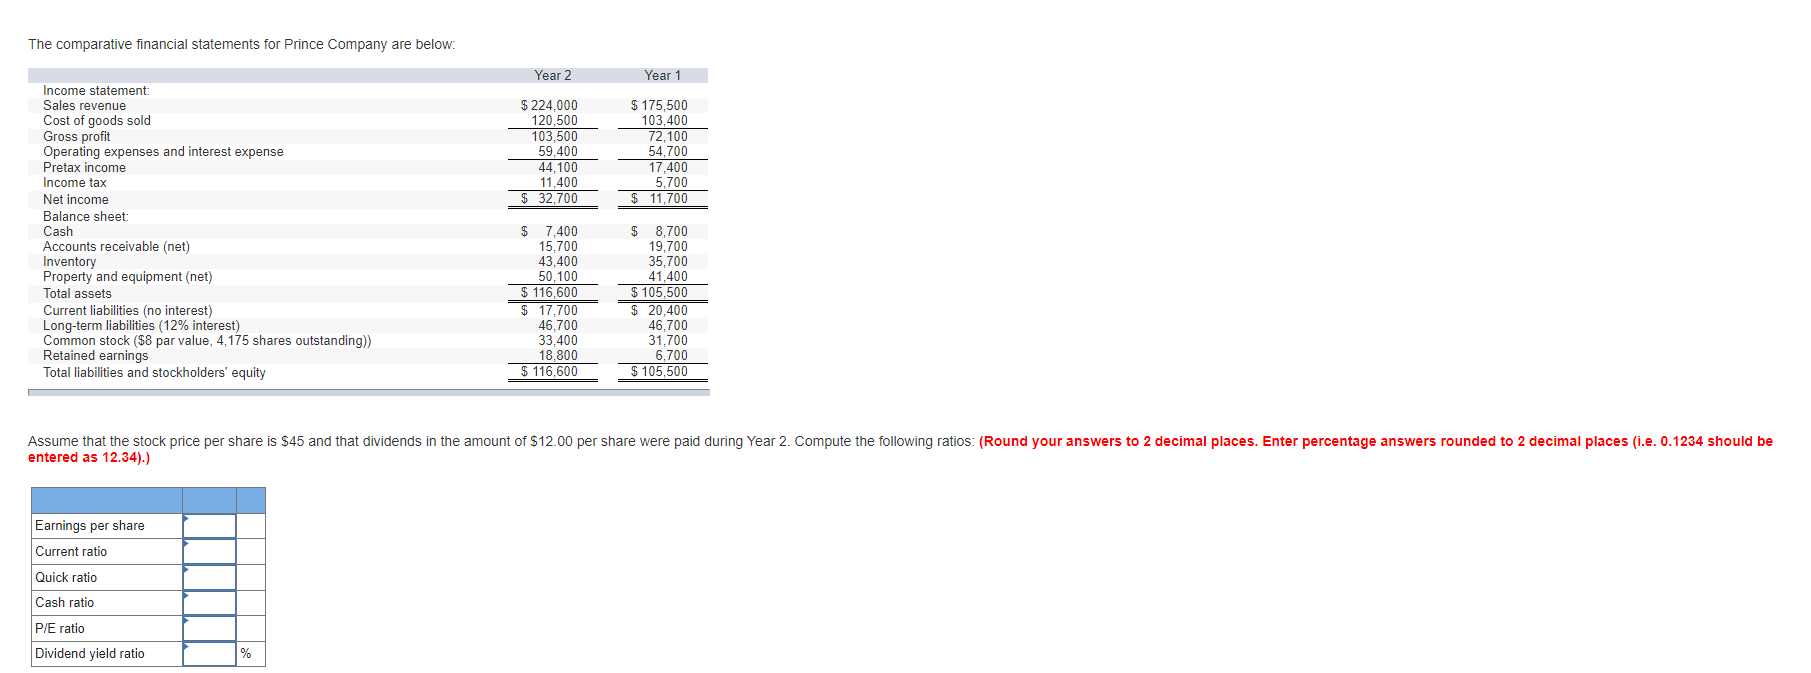
The comparative financial statements for Prince Company are below: Year 2 Year 1 $ 224,000 120,500 103,500 59,400 44.100 11,400 32.700 $ 175,500 103,400 72,100
Step by Step Solution
There are 3 Steps involved in it
Step: 1

Get Instant Access to Expert-Tailored Solutions
See step-by-step solutions with expert insights and AI powered tools for academic success
Step: 2

Step: 3
Ace Your Homework with AI
Get the answers you need in no time with our AI-driven, step-by-step assistance
Get Started
Horngren S Financial And Managerial Accounting The Managerial Chapters
Authors: Tracie L. Miller-Nobles ,Brenda L. Mattison ,Ella Mae Matsumura
4th Edition
0133255433, 978-0133255430