

Answered step by step
Verified Expert Solution
Question
1 Approved Answer
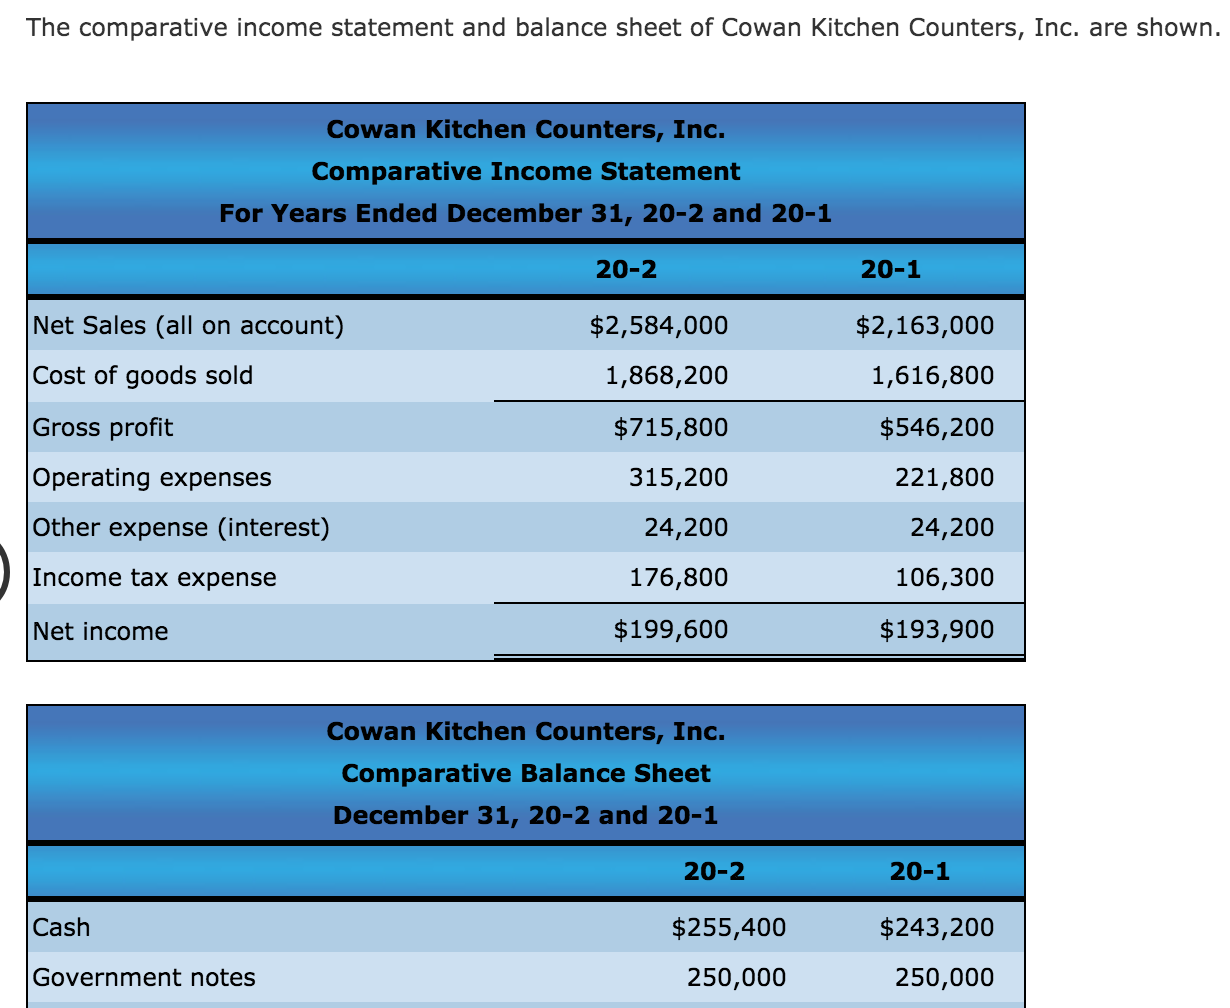
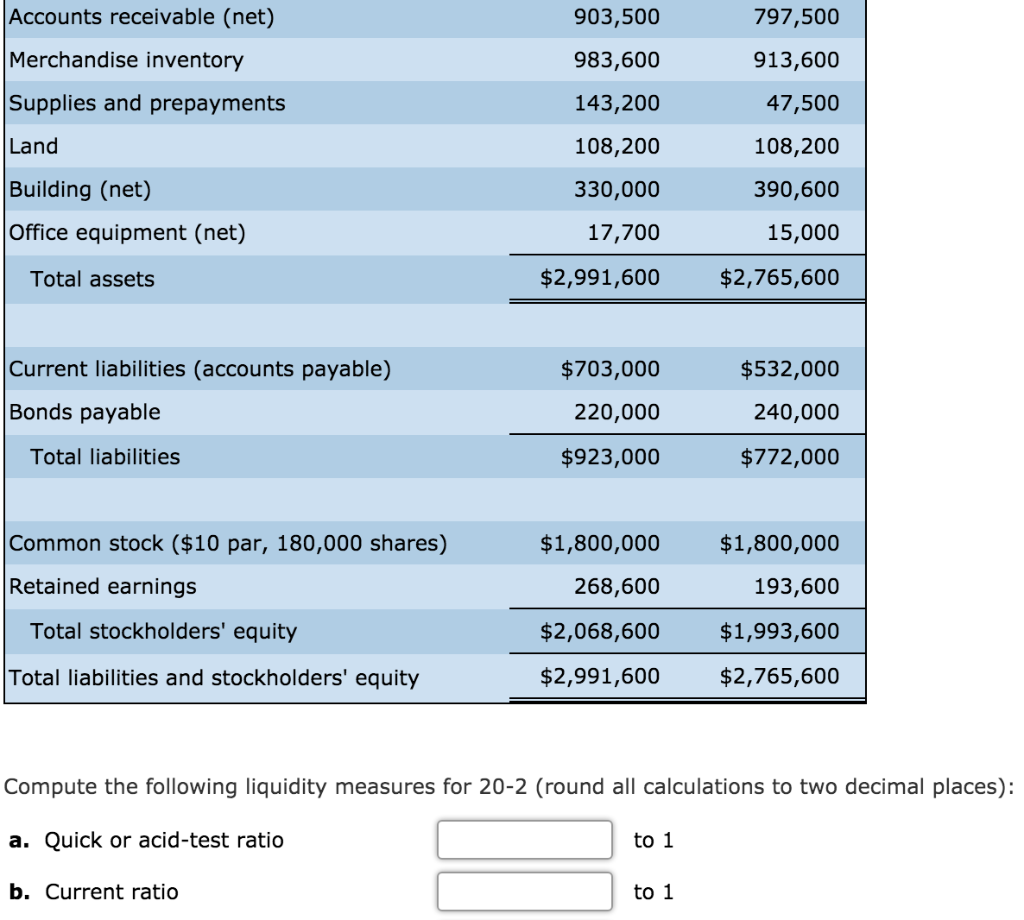
The comparative income statement and balance sheet of Cowan Kitchen Counters, Inc. are shown. 20-1 Cowan Kitchen Counters, Inc. Comparative Income Statement For Years Ended

Step by Step Solution
There are 3 Steps involved in it
Step: 1

Get Instant Access to Expert-Tailored Solutions
See step-by-step solutions with expert insights and AI powered tools for academic success
Step: 2

Step: 3
Ace Your Homework with AI
Get the answers you need in no time with our AI-driven, step-by-step assistance
Get Started
Corporate Audit Scams A Threat To Corporate Governance
Authors: Sachi Kheskani
1st Edition
3659490148, 978-3659490149