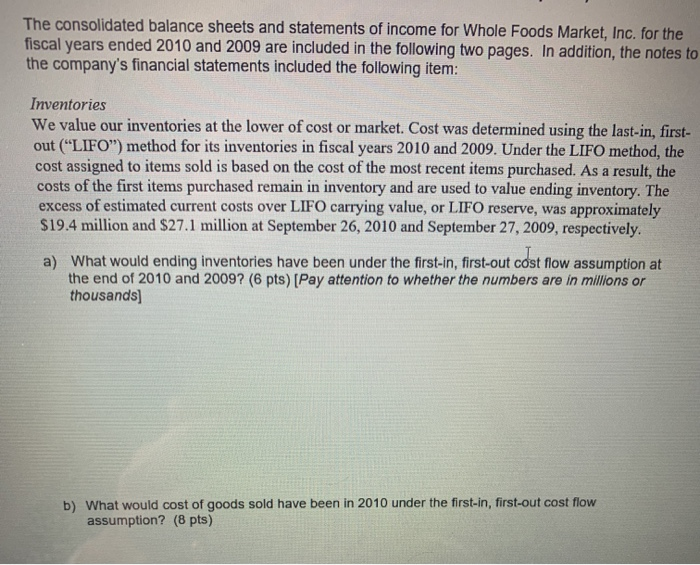
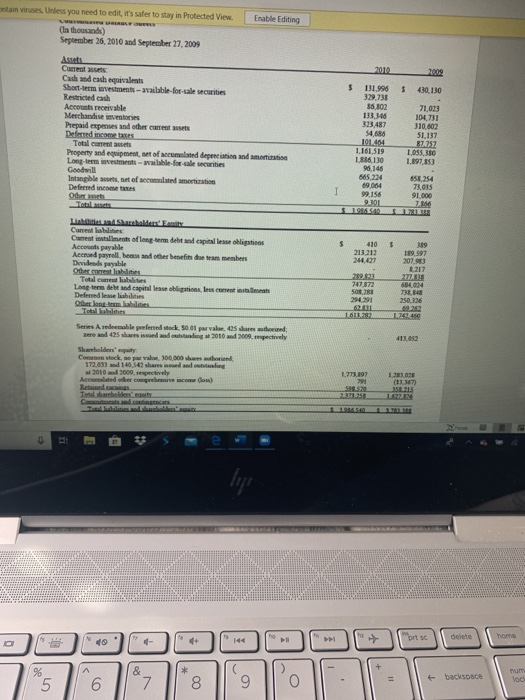
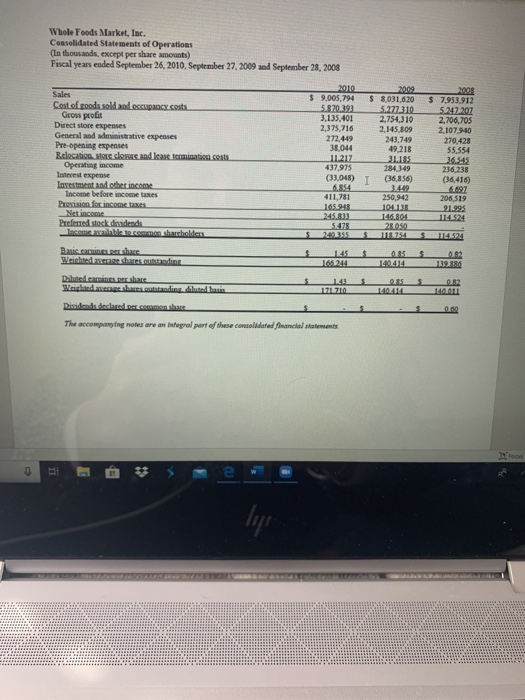
The consolidated balance sheets and statements of income for Whole Foods Market, Inc. for the fiscal years ended 2010 and 2009 are included in the following two pages. In addition, the notes to the company's financial statements included the following item: Inventories We value our inventories at the lower of cost or market. Cost was determined using the last-in, first- out ("LIFO") method for its inventories in fiscal years 2010 and 2009. Under the LIFO method, the cost assigned to items sold is based on the cost of the most recent items purchased. As a result, the costs of the first items purchased remain in inventory and are used to value ending inventory. The excess of estimated current costs over LIFO carrying value, or LIFO reserve, was approximately $19.4 million and $27.1 million at September 26, 2010 and September 27, 2009, respectively. a) What would ending inventories have been under the first-in, first-out cost flow assumption at the end of 2010 and 2009? (6 pts) (Pay attention to whether the numbers are in millions or thousands) b) What would cost of goods sold have been in 2010 under the first-in, first-out cost flow assumption? (8 pts) c) What can you infer about price level changes in 2010? Explain your reasoning (4pts) d) (bonus)Did the company declare any dividend in 2010 (including preferred dividend)? (2) e) [bonus]how much total dividend did the company distribute to the owner (investors)? Provide your reasoning (3pts) Enable Editing otain viruses. Unless you need to edit, it's safer to stay in Protected View (In thousands) September 26, 2016 and September 27, 2009 $ 430 130 Current assets: Cached eash equivaats Short-term investments- able-for-ale securities Restricted cash Accounts receivable Merchandise inventories Prepaid expenses and other current sets Deferred income taxes Totalca ts Property and equipment, set of s t ed depene in and more Long-term investments wilable for sale securities 131.995 329.733 3830 133346 323,487 71,023 104.731 310.602 SL 137 87257 LOSS BIO 101.404 1.161,519 ated mortition 665.24 89004 658 254 73.035 Intangibles, set of c Defned income Other as Total 213 212 Lid Shade Cumestabila Cara install of leer term debt and capital este obligations Accounts payable Azadparollbeadother benefits due tan bers Duvida payable Other content i s Total weibles Long term det dapibil lese obligations, les curesti Deferred lateliabilities Oha b ilities Totallites Seres A redeemable preferred to 500 per values a n d zere ole sissed 2010 2009 spectively TES 250,326 10250 413,652 Shareholders' equity Commen stock sewwal 100.000 de hond 172031 140.542 shares o g 2010 2009, respectively Acceder convince dow) 1201023 90 CL Whole Foods Market, Inc. Consolidated States of Operations (La thousands, except per share amounts) Fiscal years ended September 26, 2010 September 27, 2009 and September 28, 2008 $ S 2010 9.005,794 5.870.193 3.135.401 2.375,716 272.49 38044 11217 437,975 (1048) 18 7,953912 5247207 2,706,705 2,107 940 270.428 Sales Cost of goods sold and occupancy costs Gross profit Direct store expenses General and administrative expenses Pre opening expenses Relocation store closure and lease camination costs Operating income Interest expense Lavestment and other income Tacone before income taxes P ision for income Netcome Preferred stock dividende 55.554 $ 8031 620 5.277310 2,754,310 2.145.809 243,749 49.218 31.135 284349 T (36,856) 1449 250. 2 10 236.238 (36,416. 6697 200519 919 105.94 245 Ridder.com The accompanying notes are an integral part of these consolidated a t The consolidated balance sheets and statements of income for Whole Foods Market, Inc. for the fiscal years ended 2010 and 2009 are included in the following two pages. In addition, the notes to the company's financial statements included the following item: Inventories We value our inventories at the lower of cost or market. Cost was determined using the last-in, first- out ("LIFO") method for its inventories in fiscal years 2010 and 2009. Under the LIFO method, the cost assigned to items sold is based on the cost of the most recent items purchased. As a result, the costs of the first items purchased remain in inventory and are used to value ending inventory. The excess of estimated current costs over LIFO carrying value, or LIFO reserve, was approximately $19.4 million and $27.1 million at September 26, 2010 and September 27, 2009, respectively. a) What would ending inventories have been under the first-in, first-out cost flow assumption at the end of 2010 and 2009? (6 pts) (Pay attention to whether the numbers are in millions or thousands) b) What would cost of goods sold have been in 2010 under the first-in, first-out cost flow assumption? (8 pts) c) What can you infer about price level changes in 2010? Explain your reasoning (4pts) d) (bonus)Did the company declare any dividend in 2010 (including preferred dividend)? (2) e) [bonus]how much total dividend did the company distribute to the owner (investors)? Provide your reasoning (3pts) Enable Editing otain viruses. Unless you need to edit, it's safer to stay in Protected View (In thousands) September 26, 2016 and September 27, 2009 $ 430 130 Current assets: Cached eash equivaats Short-term investments- able-for-ale securities Restricted cash Accounts receivable Merchandise inventories Prepaid expenses and other current sets Deferred income taxes Totalca ts Property and equipment, set of s t ed depene in and more Long-term investments wilable for sale securities 131.995 329.733 3830 133346 323,487 71,023 104.731 310.602 SL 137 87257 LOSS BIO 101.404 1.161,519 ated mortition 665.24 89004 658 254 73.035 Intangibles, set of c Defned income Other as Total 213 212 Lid Shade Cumestabila Cara install of leer term debt and capital este obligations Accounts payable Azadparollbeadother benefits due tan bers Duvida payable Other content i s Total weibles Long term det dapibil lese obligations, les curesti Deferred lateliabilities Oha b ilities Totallites Seres A redeemable preferred to 500 per values a n d zere ole sissed 2010 2009 spectively TES 250,326 10250 413,652 Shareholders' equity Commen stock sewwal 100.000 de hond 172031 140.542 shares o g 2010 2009, respectively Acceder convince dow) 1201023 90 CL Whole Foods Market, Inc. Consolidated States of Operations (La thousands, except per share amounts) Fiscal years ended September 26, 2010 September 27, 2009 and September 28, 2008 $ S 2010 9.005,794 5.870.193 3.135.401 2.375,716 272.49 38044 11217 437,975 (1048) 18 7,953912 5247207 2,706,705 2,107 940 270.428 Sales Cost of goods sold and occupancy costs Gross profit Direct store expenses General and administrative expenses Pre opening expenses Relocation store closure and lease camination costs Operating income Interest expense Lavestment and other income Tacone before income taxes P ision for income Netcome Preferred stock dividende 55.554 $ 8031 620 5.277310 2,754,310 2.145.809 243,749 49.218 31.135 284349 T (36,856) 1449 250. 2 10 236.238 (36,416. 6697 200519 919 105.94 245 Ridder.com The accompanying notes are an integral part of these consolidated a t
