the critical value should be z_alpha, not z_alpha/2. So for a 95% confidence bound, you should use z_0.05 = 1.645. Do not use z_0.025.
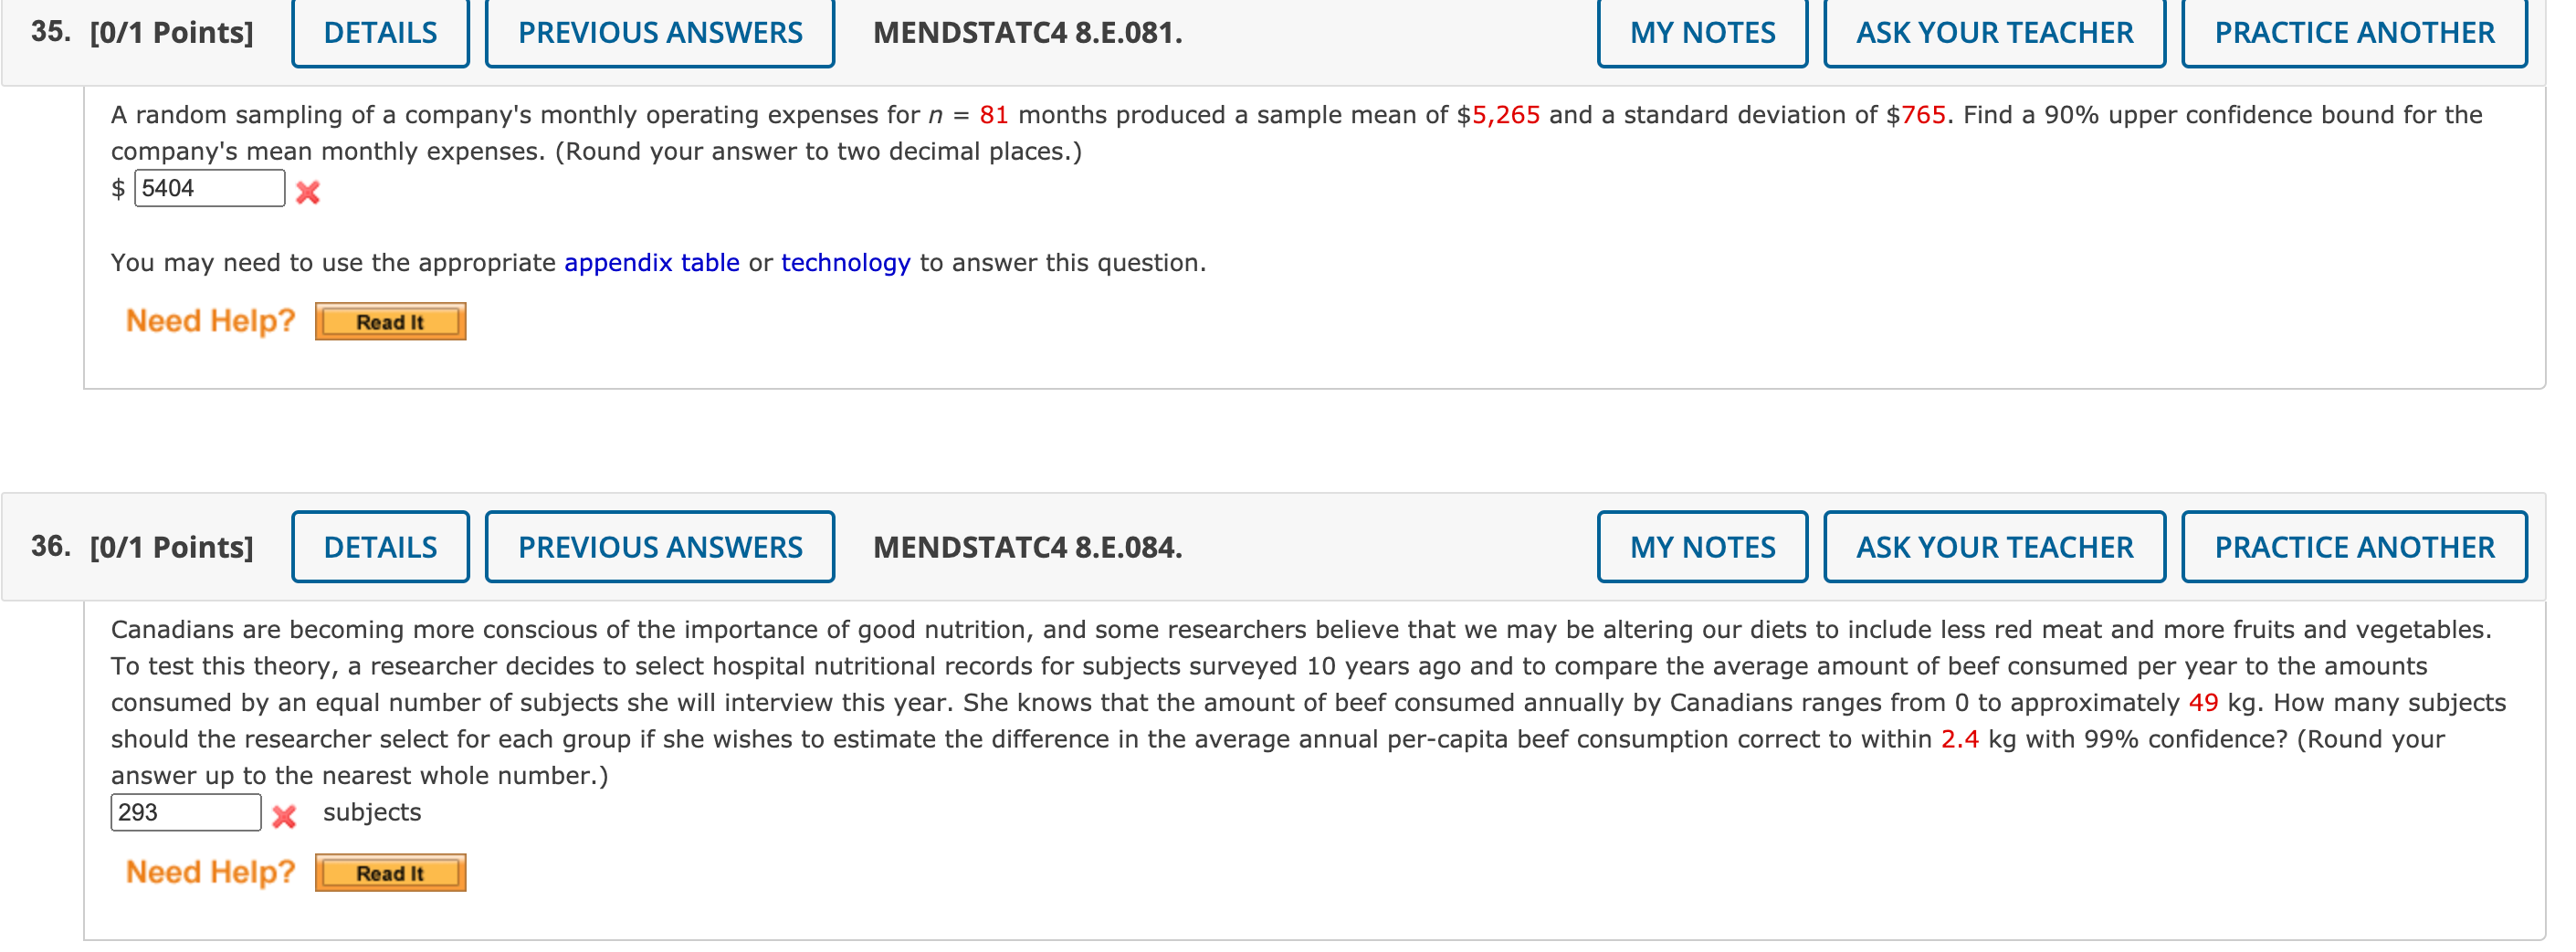
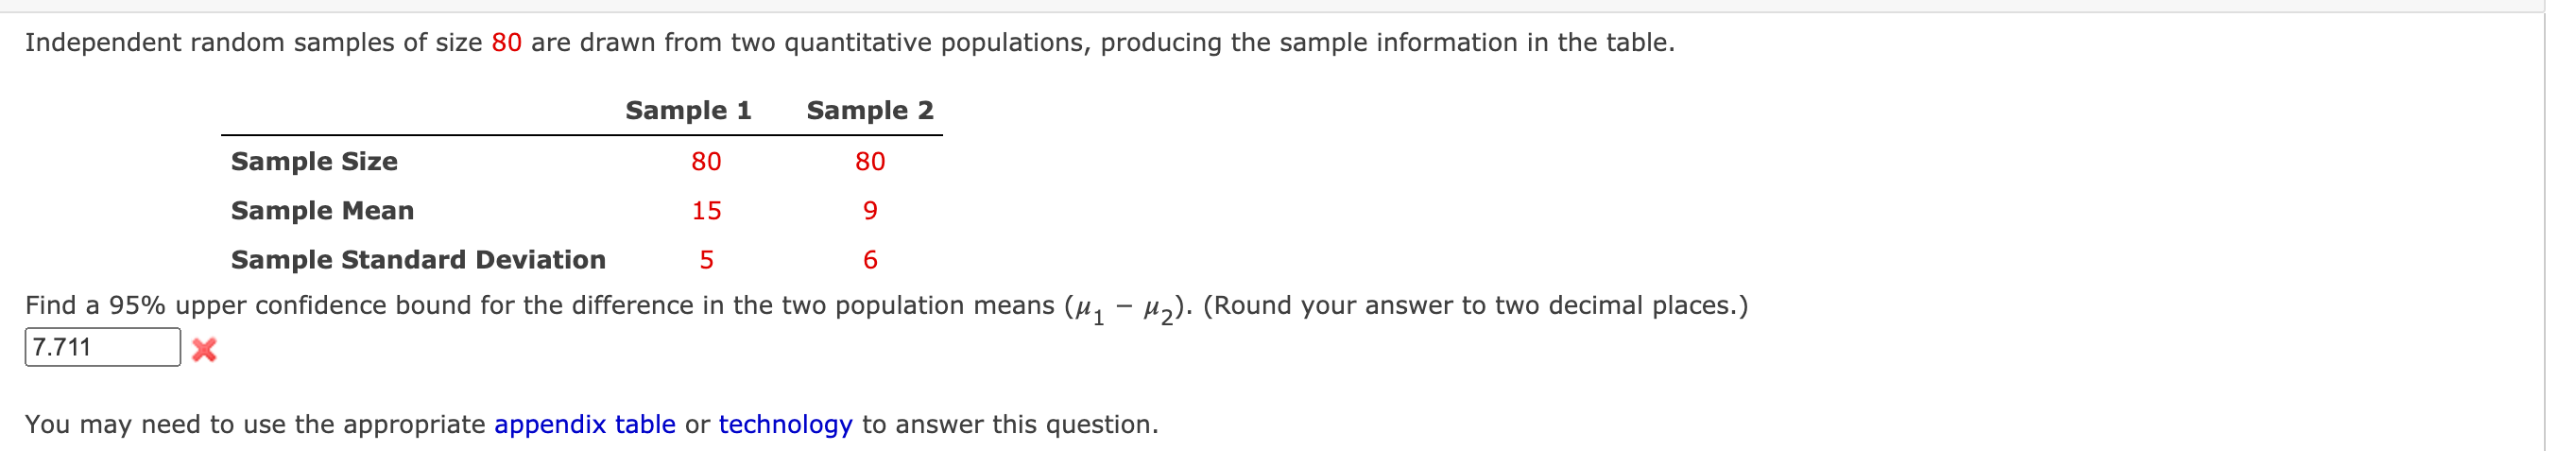
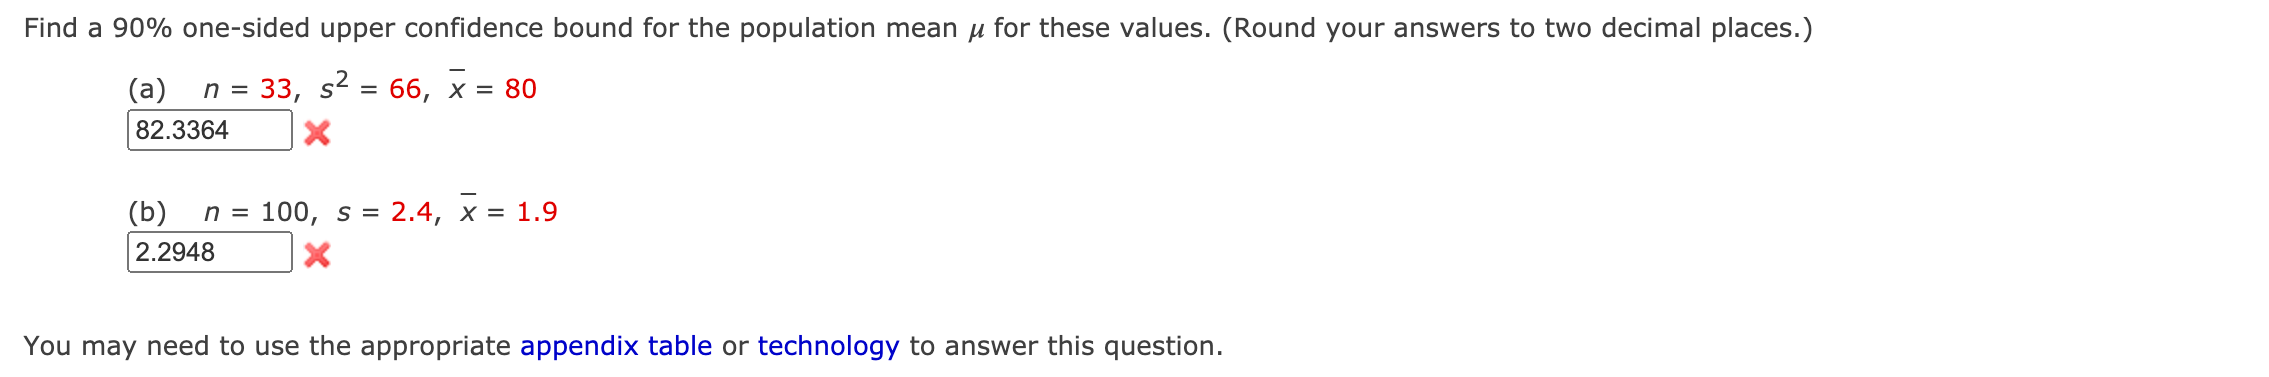
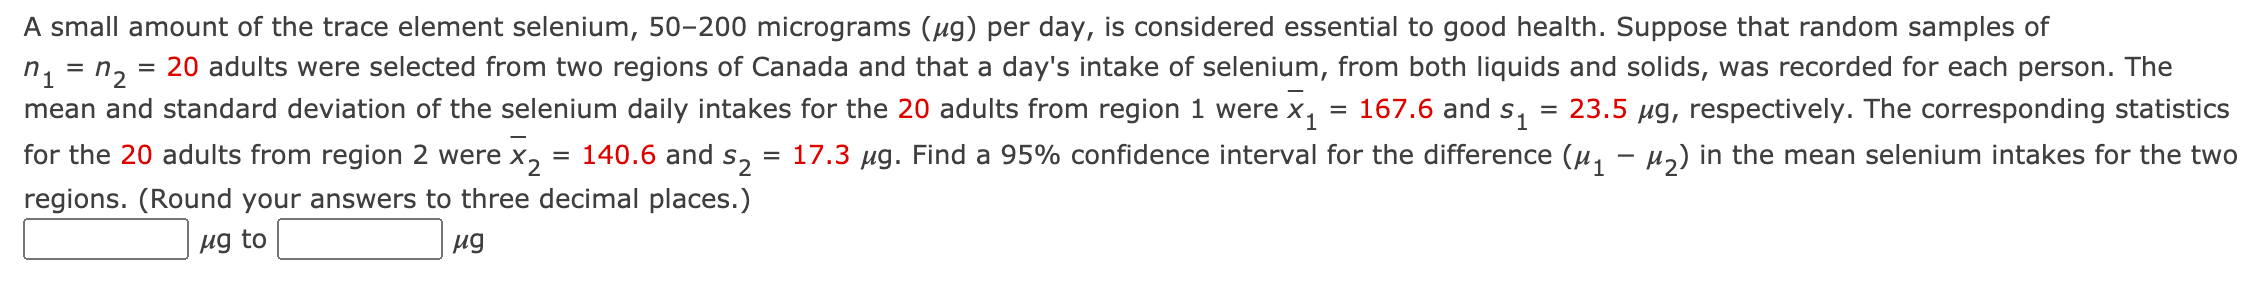
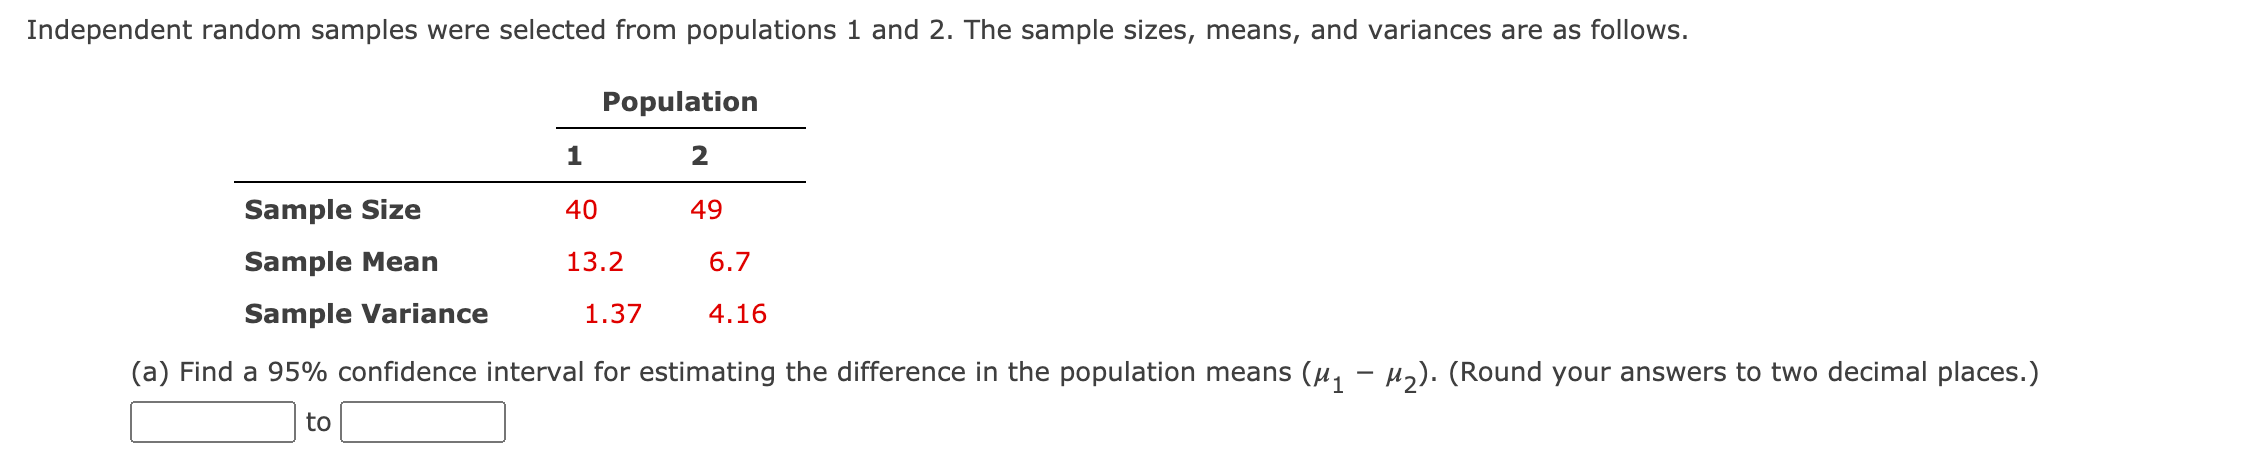
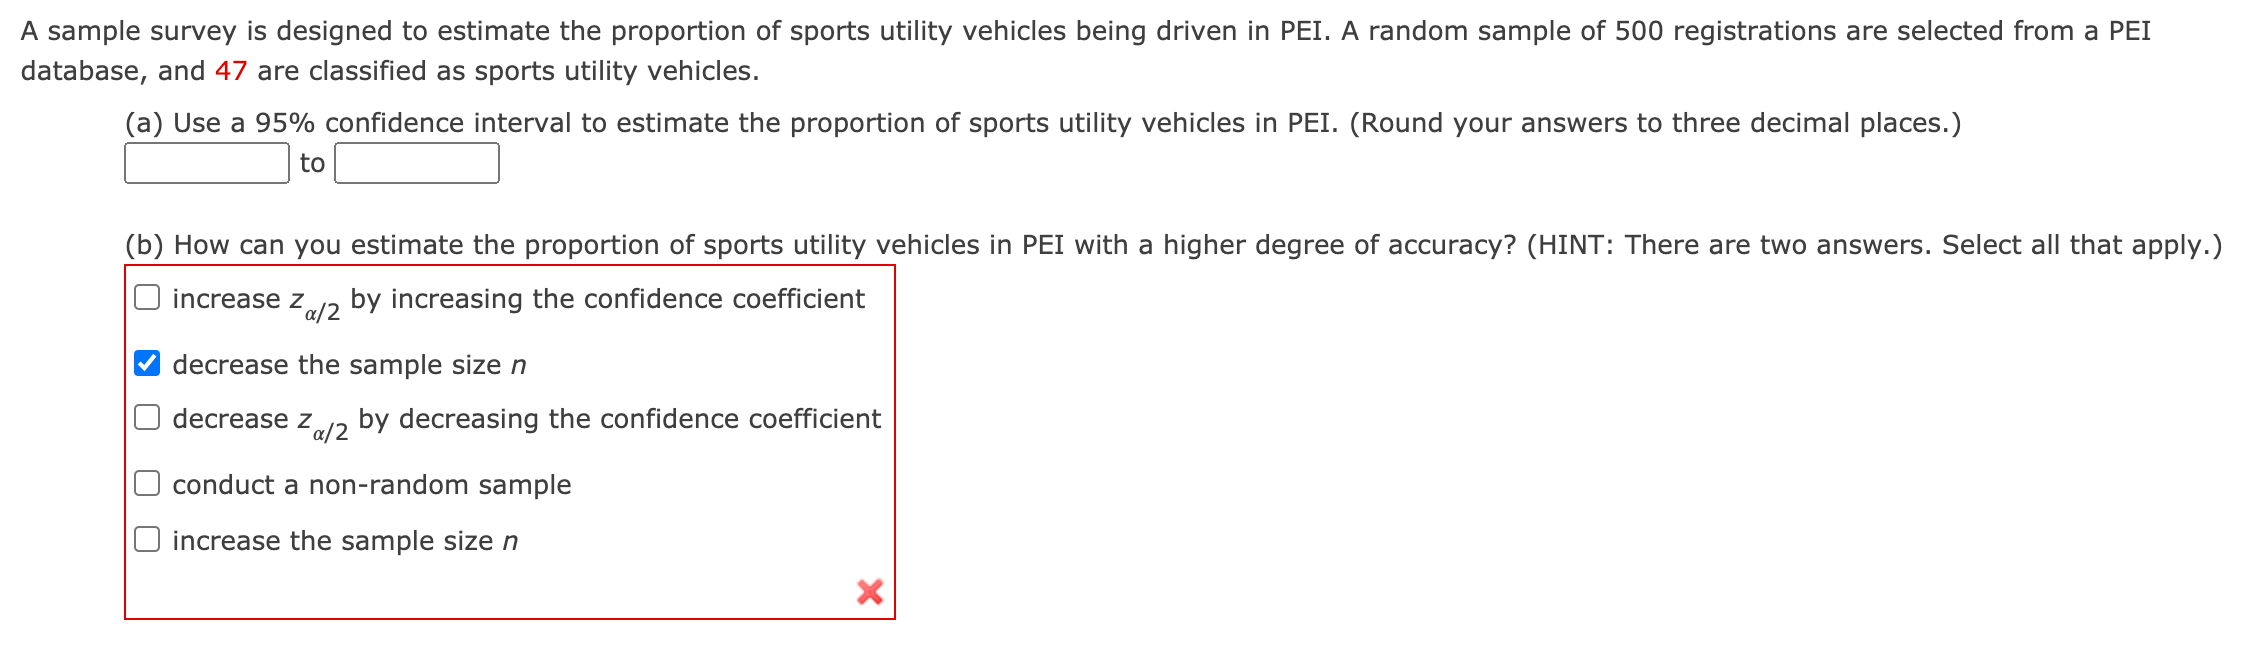
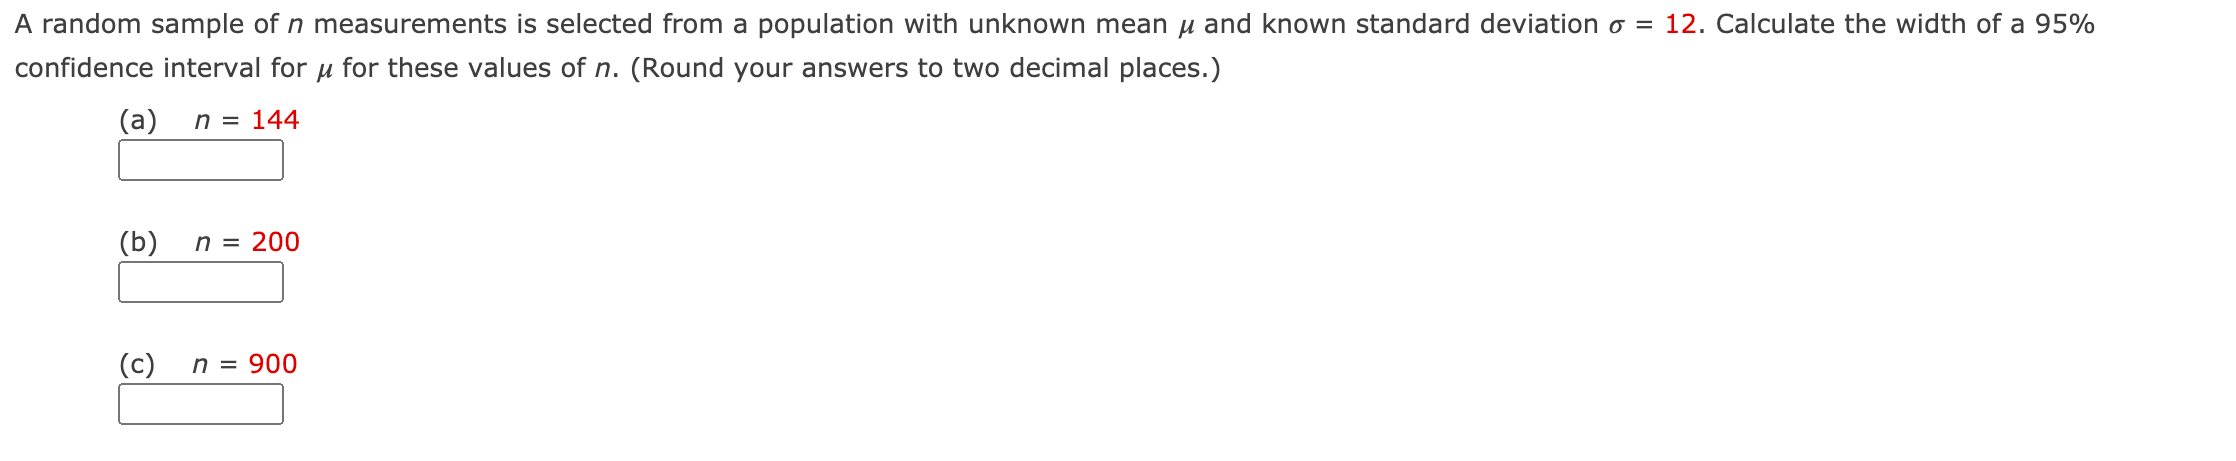
35. [0/1 Points] DETAILS PREVIOUS ANSWERS MENDSTATC4 8.E.081. MY NOTES ASK YOUR TEACHER PRACTICE ANOTHER A random sampling of a company's monthly operating expenses for n = 81 months produced a sample mean of $5,265 and a standard deviation of $765. Find a 90% upper confidence bound for the company's mean monthly expenses. (Round your answer to two decimal places.) $ 5404 X You may need to use the appropriate appendix table or technology to answer this question. Need Help? Read It 36. [0/1 Points] DETAILS PREVIOUS ANSWERS MENDSTATC4 8.E.084. MY NOTES ASK YOUR TEACHER PRACTICE ANOTHER Canadians are becoming more conscious of the importance of good nutrition, and some researchers believe that we may be altering our diets to include less red meat and more fruits and vegetables. To test this theory, a researcher decides to select hospital nutritional records for subjects surveyed 10 years ago and to compare the average amount of beef consumed per year to the amounts consumed by an equal number of subjects she will interview this year. She knows that the amount of beef consumed annually by Canadians ranges from 0 to approximately 49 kg. How many subjects should the researcher select for each group if she wishes to estimate the difference in the average annual per-capita beef consumption correct to within 2.4 kg with 99% confidence? (Round your answer up to the nearest whole number.) 293 X subjects Need Help? Read ItIndependent random samples of size 80 are drawn from two quantitative populations, producing the sample information in the table. Sample 1 Sample 2 Sample Size 80 80 Sample Mean 15 9 Sample Standard Deviation 5 6 Find a 95% upper condence bound for the difference in the two population means (;41 \"2)' (Round your answer to two decimal places.) 7.711 x You may need to use the appropriate appendix table or technology to answer this question. Find a 90% one-sided upper confidence bound for the population mean u for these values. (Round your answers to two decimal places.) (a) n=33, 52:66, E=so 82.3364 x (b) n = 100, s = 2.4, x = 1.9 2.2948 x You may need to use the appropriate appendix table or technology to answer this question. A small amount of the trace element selenium, 50200 micrograms (pg) per day, is considered essential to good health. Suppose that random samples of n1 = n2 = 20 adults were selected from two regions of Canada and that a day's intake of selenium, from both liquids and solids, was recorded for each person. The mean and standard deviation of the selenium daily intakes for the 20 adults from region 1 were x1 = 167.6 and s1 = 23.5 Mg, respectively. The corresponding statistics for the 20 adults from region 2 were )_(2 = 140.6 and 52 = 17.3 [49. Find a 95% condence interval for the difference ([41 [42) in the mean selenium intakes for the two regions. (Round your answers to three decimal places.) Independent random samples of size n1 = 112 = 100 were selected from each of two populations. The mean and standard deviations for the two samples were 21 = 125.4, }2 = 123.9, 51 = 5.3, and 52 = 6.5. (a) Construct a 99% condence interval for estimating the difference in the two population means ([41 [42). (Round your answers to two decimal places.) t0 Independent random samples were selected from populations 1 and 2. The sample sizes, means, and variances are as follows. Population 1 2 Sample Size 40 49 Sample Mean 13.2 6.7 Sample Variance 1.37 4.16 (a) Find a 95% confidence interval for estimating the difference in the population means ([41 [42)- (Round your answers to two decimal places.) t0 A sample survey is designed to estimate the proportion of sports utility vehicles being driven in PEI. A random sample of 500 registrations are selected from a PEI database, and 47 are classied as sports utility vehicles. (a) Use a 95% confidence interval to estimate the proportion of sports utility vehicles in PEI. (Round your answers to three decimal places.) to (b) How can you estimate the proportion of sports utility vehicles in PEI with a higher degree of accuracy? (HINT: There are two answers. Select all that apply.) increase zm/2 by increasing the confidence coefcient decrease the sample size n decrease zm/2 by decreasing the confidence coefficient conduct a non-random sample increase the sample size n A random sample of n measurements is selected from a population with unknown mean y and known standard deviation o = 12. Calculate the width of a 95% confidence interval for u for these values of n. (Round your answers to two decimal places.) (a) n = 144 (b) n = 200 (c) n = 900