

Question
The current year financial statements for Blue Water Company and Prime Fish Company are presented below. Blue Water Prime Fish Balance sheet: Cash $ 41,800
The current year financial statements for Blue Water Company and Prime Fish Company are presented below.
| Blue Water | Prime Fish | ||||||
| Balance sheet: | |||||||
| Cash | $ | 41,800 | $ | 20,200 | |||
| Accounts receivable (net) | 42,000 | 33,400 | |||||
| Inventory | 95,000 | 44,800 | |||||
| Property & equipment (net) | 152,000 | 410,600 | |||||
| Other assets | 84,800 | 313,000 | |||||
| Total assets | $ | 415,600 | $ | 822,000 | |||
| Current liabilities | $ | 95,000 | $ | 61,000 | |||
| Long-term debt (interest rate: 10%) | 70,600 | 61,600 | |||||
| Capital stock ($10 par value) | 153,600 | 520,000 | |||||
| Additional paid-in capital | 29,800 | 106,800 | |||||
| Retained earnings | 66,600 | 72,600 | |||||
| Total liabilities and stockholders equity | $ | 415,600 | $ | 822,000 | |||
| Income statement: | |||||||
| Sales revenue (1/3 on credit) | $ | 435,000 | $ | 794,000 | |||
| Cost of goods sold | (237,000 | ) | (400,800 | ) | |||
| Operating expenses | (162,600 | ) | (311,800 | ) | |||
| Net income | $ | 35,400 | $ | 81,400 | |||
| Other data: | |||||||
| Per share stock price at end of current year | $ | 22.8 | $ | 23 | |||
| Average income tax rate | 30 | % | 30 | % | |||
| Dividends declared and paid in current year | $ | 33,800 | $ | 152,000 | |||
Both companies are in the fish catching and manufacturing business. Both have been in business approximately 10 years, and each has had steady growth. The management of each has a different viewpoint in many respects. Blue Water is more conservative, and as its president has said, We avoid what we consider to be undue risk. Neither company is publicly held.
Required:
1. Complete a schedule that reflects a ratio analysis of each company. (Round your intermediate calculations and final answers to 2 decimal places. Enter percentage answers rounded to 2 decimal places (i.e. 0.1234 should be entered as 12.34).)
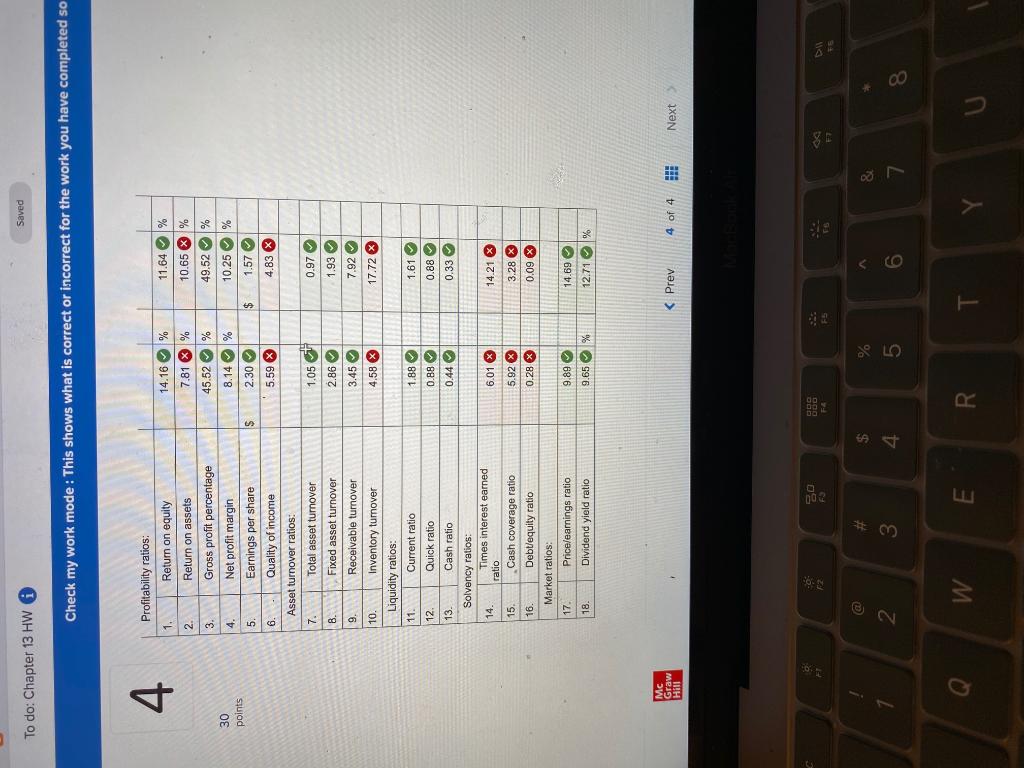
PLEASE ANSWER THOSE WRONG ANSWERS!! this is the third time im posting
Saved To do: Chapter 13 HW Check my work mode: This shows what is correct or incorrect for the work you have completed so 4 11.64% 14.16 % 7.81 X % 45.52 30 points Profitability ratios: 1. Return on equity 2. Return on assets 3. Gross profit percentage 4. Net profit margin 5. Earnings per share 6. Quality of income Asset turnover ratios: 7. Total asset turnover 10.65 X % 49.52% 10.25% 1.57 8.14 % $ 2.30 5.59 X 4.83 X 1.05 0.97 1.93 8. 2.86 Fixed asset turnover Receivable turnover 9. 3.45 7.92 4.58 x 17.72 1.88 0.88 0.44 1.61 0.88 0.33 10. Inventory turnover Liquidity ratios: 11. Current ratio 12 Quick ratio 13. Cash ratio Solvency ratios: Times interest earned 14. ratio 15. Cash coverage ratio 16. Debt/equity ratio Market ratios: 17. Pricelearnings ratio 18. Dividend yield ratio 6.01 X 14.21 x 3.28 X 5.92 x 0.28 X 0.09 X 9.89 14.69 9.65 % 12.71 Mc Graw Hill 9 2 FO FA DW To @ $ % # 3 2 4 5 6 7 8 W E R YStep by Step Solution
There are 3 Steps involved in it
Step: 1

Get Instant Access to Expert-Tailored Solutions
See step-by-step solutions with expert insights and AI powered tools for academic success
Step: 2

Step: 3
Ace Your Homework with AI
Get the answers you need in no time with our AI-driven, step-by-step assistance
Get Started
Financial Collateral Law And Practice
Authors: Matthias Haentjens
1st Edition
9780192557575