Answered step by step
Verified Expert Solution
Link Copied!

Question

1 Approved Answer

The curves on the following graph show the prices of two 10% annual coupon bonds at various interest rates. BOND VALUE ISI 2000 1750 1500
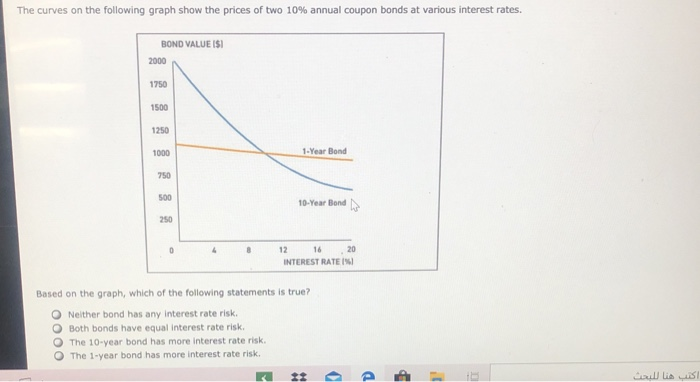
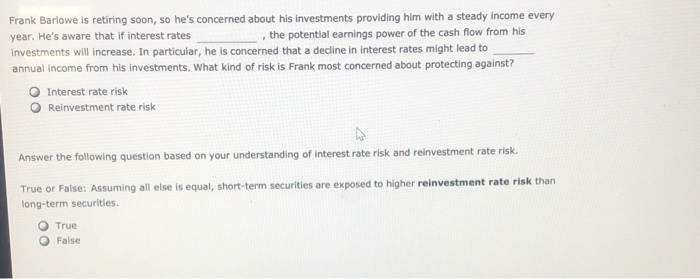
image text in transcribed
The curves on the following graph show the prices of two 10% annual coupon bonds at various interest rates. BOND VALUE ISI 2000 1750 1500 1250 1000 1-Year Bond 750 500 10-Year Bond 250 0 12 20 INTEREST RATES Based on the graph, which of the following statements is true? O Neither bond has any interest rate risk Both bonds have equal interest rate risk The 10-year bond has more interest rate risk The 1-year bond has more interest rate risk. . e Frank Barlowe is retiring soon, so he's concerned about his investments providing him with a steady income every year. He's aware that if interest rates the potential earnings power of the cash flow from his investments will increase. In particular, he is concerned that a decline in interest rates might lead to annual income from his investments. What kind of risk is Frank most concerned about protecting against? Interest rate risk Reinvestment rate risk Answer the following question based on your understanding of interest rate risk and reinvestment rate risk. True or False: Assuming all else is equal, short-term securities are exposed to higher reinvestment rate risk than long-term securities True False

Step by Step Solution

There are 3 Steps involved in it

Step: 1

blur-text-image

Get Instant Access to Expert-Tailored Solutions

See step-by-step solutions with expert insights and AI powered tools for academic success

Step: 2

blur-text-image

Step: 3

blur-text-image

Ace Your Homework with AI

Get the answers you need in no time with our AI-driven, step-by-step assistance

Get Started

Recommended Textbook for

More Books

Students also viewed these Finance questions