Question
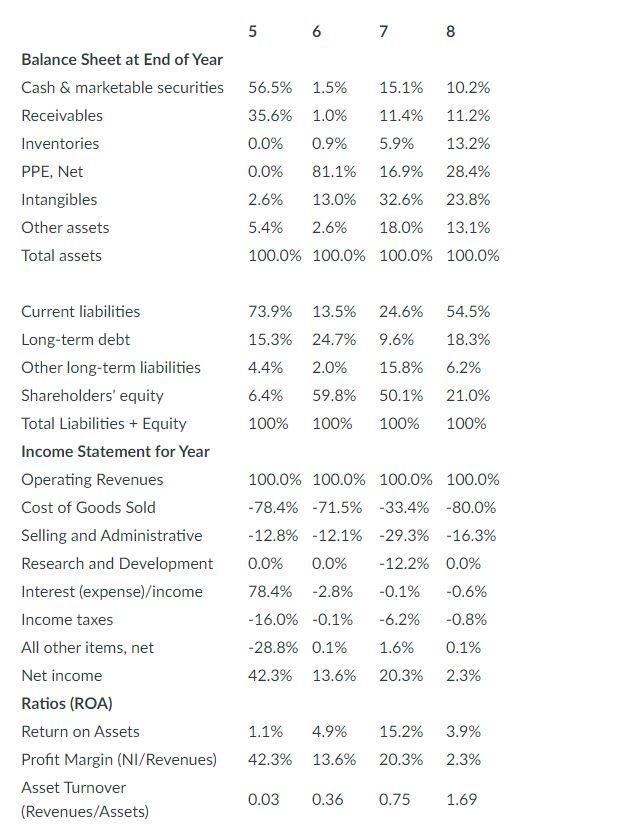
The data above relates to four firms: (A) A pharmaceutical company that invents and sells new drugs (e.g., Eli Lilly, Pfizer) (B) A pharmaceutical company

The data above relates to four firms: (A) A pharmaceutical company that invents and sells new drugs (e.g., Eli Lilly, Pfizer) (B) A pharmaceutical company that also invents drugs, but mostly produces and sells generic versions of drugs that have gone off-patent (e.g., Mylan, Teva pharmaceuticals), (C) A drugstore that retails other products in addition to prescription drugs (e.g., CVS, Walgreens), and (D) A wholesaler and distributor of prescription drugs (e.g., Cardinal Health, McKesson).
The drugstore company is:
Group of answer choices
Firm 1
Firm 2
Firm 3
Firm 4
5 6 7 8 56.5% 1.5% 15.1% 10.2% 35.6% 1.0% 11.4% 11.2% 0.0% 0.9% 5.9% 13.2% Balance Sheet at End of Year Cash & marketable securities Receivables Inventories PPE, Net Intangibles Other assets Total assets 0.0% 81.1% 16.9% 28.4% 2.6% 13.0% 32.6% 23.8% 5.4% 2.6% 18.0% 13.1% 100.0% 100.0% 100.0% 100.0% 73.9% 13.5% 24.6% 54.5% 15.3% 24.7% 9.6% 18.3% 4.4% 2.0% 15.8% 6.2% 6.4% 59.8% 50.1% 21.0% 100% 100% 100% 100% Current liabilities Long-term debt Other long-term liabilities Shareholders' equity Total Liabilities + Equity Income Statement for Year Operating Revenues Cost of Goods Sold Selling and Administrative Research and Development Interest (expense)/income Income taxes All other items, net Net income Ratios (ROA) Return on Assets Profit Margin (NI/Revenues) Asset Turnover (Revenues/Assets) 100.0% 100.0% 100.0% 100.0% -78.4% -71.5% -33.4% -80.0% -12.8% -12.1% -29.3% -16.3% 0.0% 0.0% - 12.2% 0.0% -0.1% -0.6% 78.4% -2.8% - 16.0% 0.1% -28.8% 0.1% -6.2% -0.8% 1.6% 0.1% 42.3% 13.6% 20.3% 2.3% 1.1% 4.9% 15.2% 3.9% 42.3% 13.6% 20.3% 2.3% 0.03 0.36 0.75 1.69 5 6 7 8 56.5% 1.5% 15.1% 10.2% 35.6% 1.0% 11.4% 11.2% 0.0% 0.9% 5.9% 13.2% Balance Sheet at End of Year Cash & marketable securities Receivables Inventories PPE, Net Intangibles Other assets Total assets 0.0% 81.1% 16.9% 28.4% 2.6% 13.0% 32.6% 23.8% 5.4% 2.6% 18.0% 13.1% 100.0% 100.0% 100.0% 100.0% 73.9% 13.5% 24.6% 54.5% 15.3% 24.7% 9.6% 18.3% 4.4% 2.0% 15.8% 6.2% 6.4% 59.8% 50.1% 21.0% 100% 100% 100% 100% Current liabilities Long-term debt Other long-term liabilities Shareholders' equity Total Liabilities + Equity Income Statement for Year Operating Revenues Cost of Goods Sold Selling and Administrative Research and Development Interest (expense)/income Income taxes All other items, net Net income Ratios (ROA) Return on Assets Profit Margin (NI/Revenues) Asset Turnover (Revenues/Assets) 100.0% 100.0% 100.0% 100.0% -78.4% -71.5% -33.4% -80.0% -12.8% -12.1% -29.3% -16.3% 0.0% 0.0% - 12.2% 0.0% -0.1% -0.6% 78.4% -2.8% - 16.0% 0.1% -28.8% 0.1% -6.2% -0.8% 1.6% 0.1% 42.3% 13.6% 20.3% 2.3% 1.1% 4.9% 15.2% 3.9% 42.3% 13.6% 20.3% 2.3% 0.03 0.36 0.75 1.69Step by Step Solution
There are 3 Steps involved in it
Step: 1

Get Instant Access to Expert-Tailored Solutions
See step-by-step solutions with expert insights and AI powered tools for academic success
Step: 2

Step: 3

Ace Your Homework with AI
Get the answers you need in no time with our AI-driven, step-by-step assistance
Get Started


