Answered step by step
Verified Expert Solution
Link Copied!

Question

1 Approved Answer

the data below were gathered in a random sample of basking sharks, swimming through the water and filter-feeding. Short Answer 8. The data below were

the data below were gathered in a random sample of basking sharks, swimming through the water and filter-feeding.
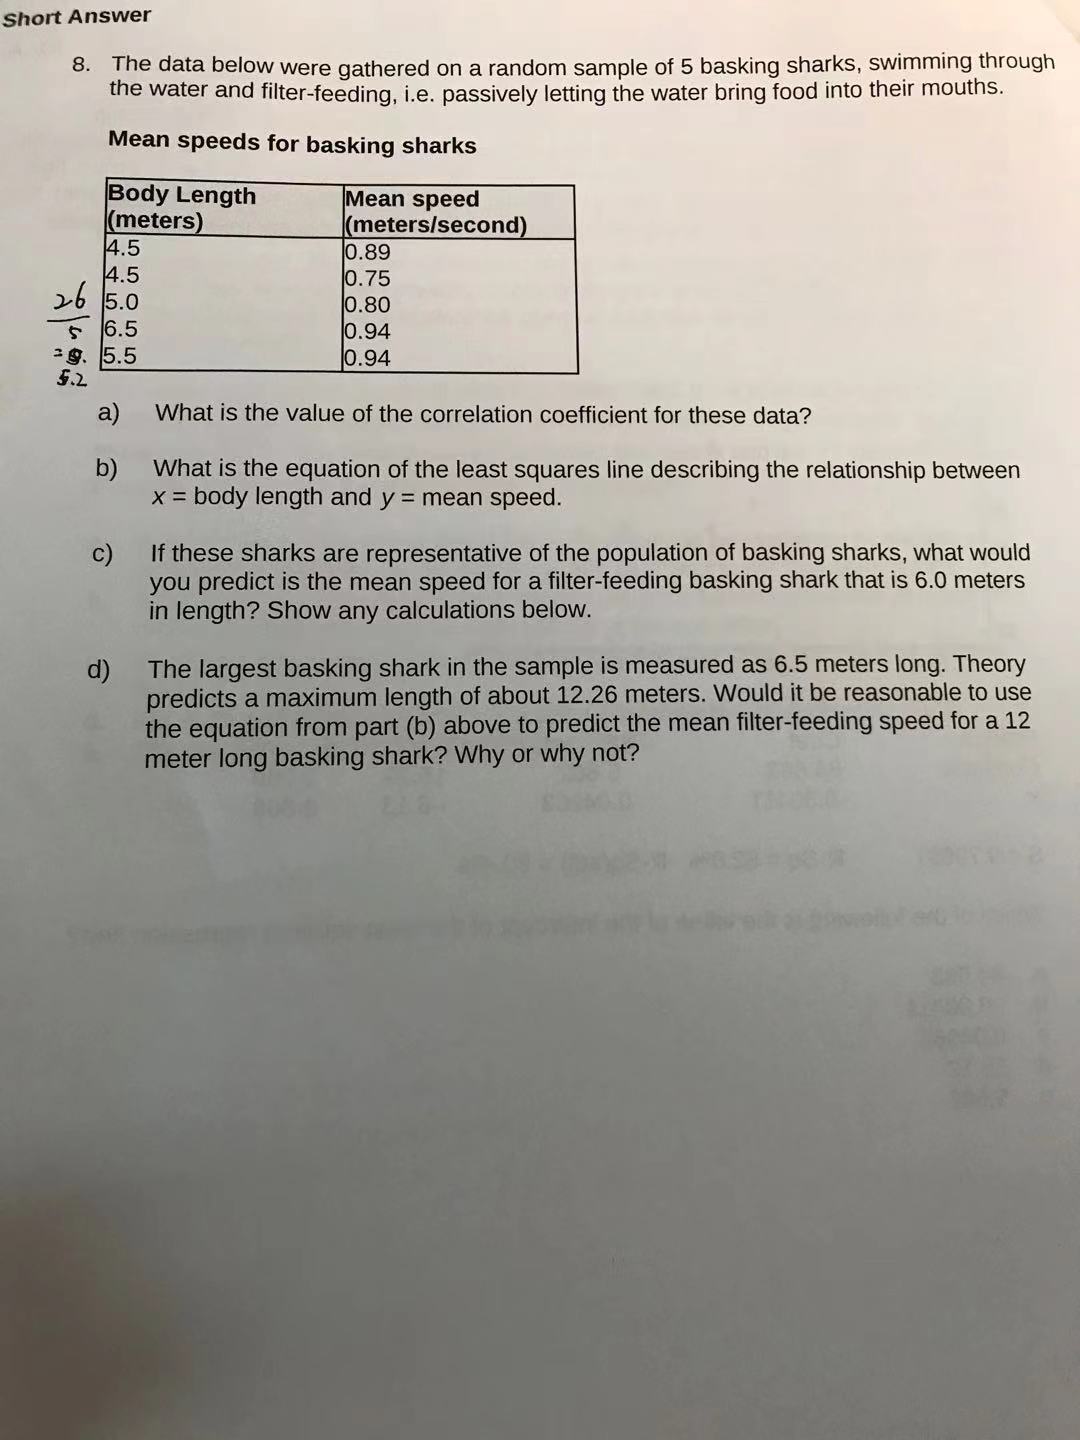
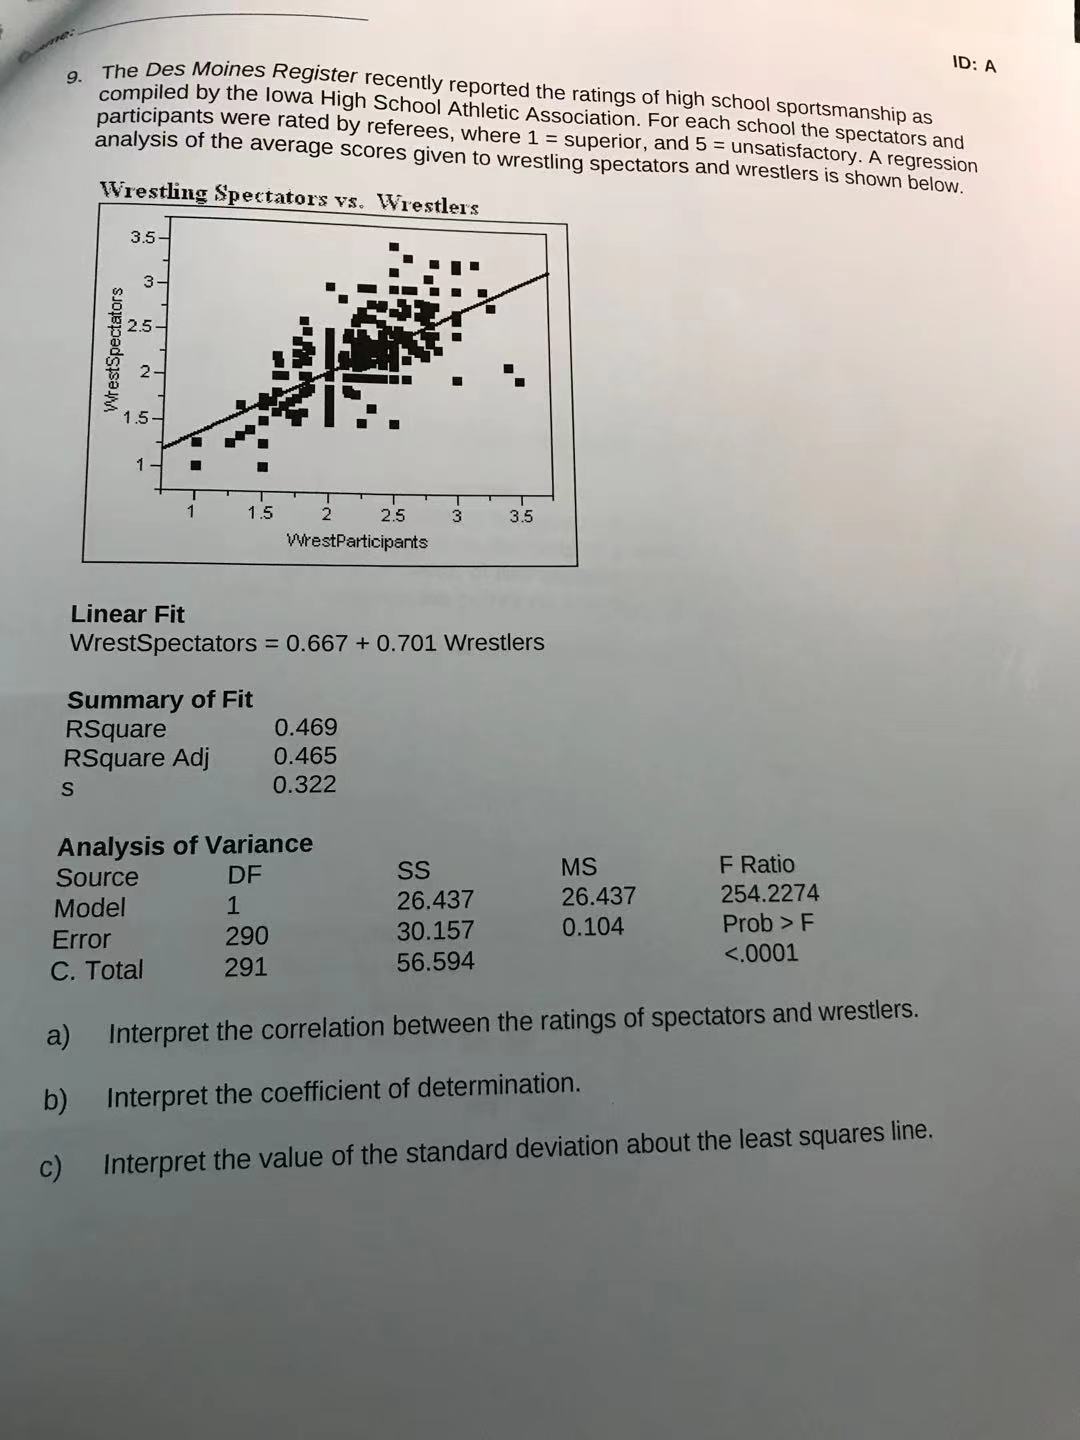
image text in transcribedimage text in transcribed
Short Answer 8. The data below were gathered on a random sample of 5 basking sharks, swimming through the water and filter-feeding, i.e. passively letting the water bring food into their mouths. Mean speeds for basking sharks Body Length Mean speed (meters) (meters/second) 4.5 0.89 14.5 0.75 26 5.0 0.80 5 16.5 0.94 =9. 5.5 0.94 5.2 a) What is the value of the correlation coefficient for these data? b) What is the equation of the least squares line describing the relationship between x = body length and y = mean speed. C) If these sharks are representative of the population of basking sharks, what would you predict is the mean speed for a filter-feeding basking shark that is 6.0 meters in length? Show any calculations below. d) The largest basking shark in the sample is measured as 6.5 meters long. Theory predicts a maximum length of about 12.26 meters. Would it be reasonable to use the equation from part (b) above to predict the mean filter-feeding speed for a 12 meter long basking shark? Why or why not?9 . ID: A The Des Moines Register recently reported the ratings of high school sportsmanship as compiled by the lowa High School Athletic Association. For each school the spectators and participants were rated by referees, where 1 = superior, and 5 = unsatisfactory. A regression analysis of the average scores given to wrestling spectators and wrestlers is shown below. Wrestling Spectators vs. Wrestlers 3.5- 3- 2.5 WrestSpectators 2- 15 15 2 2.5 3 3.5 vrestParticipants Linear Fit WrestSpectators = 0.667 + 0.701 Wrestlers Summary of Fit RSquare 0.469 RSquare Adj 0.465 S 0.322 Analysis of Variance Source DF SS MS F Ratio Model 1 26.437 26.437 254.2274 Error 290 30.157 0.104 Prob > F C. Total 291 56.594 <.0001 a interpret the correlation between ratings of spectators and wrestlers. b coefficient determination. c value standard deviation about least squares line>

Step by Step Solution

There are 3 Steps involved in it

Step: 1

blur-text-image

Get Instant Access to Expert-Tailored Solutions

See step-by-step solutions with expert insights and AI powered tools for academic success

Step: 2

blur-text-image_2

Step: 3

blur-text-image_3

Ace Your Homework with AI

Get the answers you need in no time with our AI-driven, step-by-step assistance

Get Started

Recommended Textbook for

A Short Course In Automorphic Functions

Authors: Joseph Lehner

1st Edition

0486799921, 9780486799926

More Books

Students also viewed these Mathematics questions