

Answered step by step
Verified Expert Solution
Question
1 Approved Answer
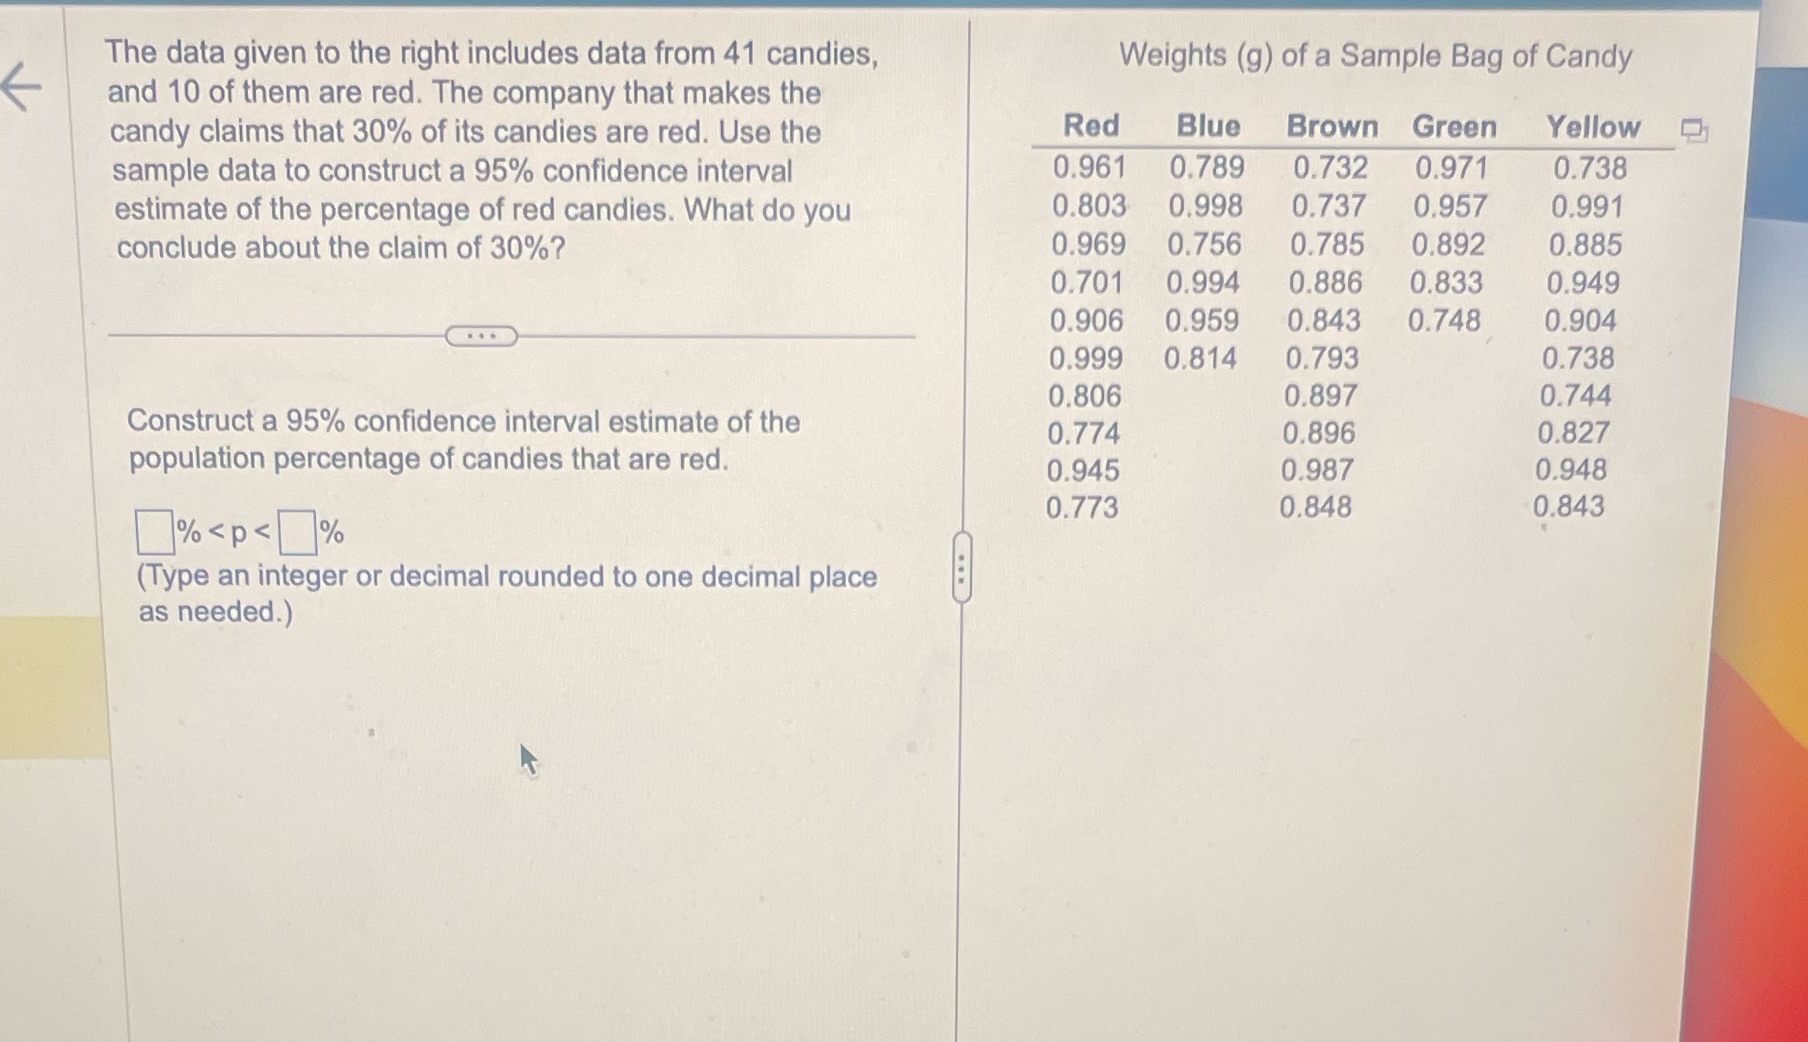
The data given to the right includes data from 41 candies, Weights (g) of a Sample Bag of Candy and 10 of them are red.
Step by Step Solution
There are 3 Steps involved in it
Step: 1

Get Instant Access to Expert-Tailored Solutions
See step-by-step solutions with expert insights and AI powered tools for academic success
Step: 2

Step: 3
Ace Your Homework with AI
Get the answers you need in no time with our AI-driven, step-by-step assistance
Get Started
Precalculus Enhanced With Graphing Utilities (Subscription)
Authors: Michael, Michael Sullivan III, Michael III Sullivan, III Sullivan
6th Edition
0321849108, 9780321849106