The data in the starter file represents weekly changes in the stock prices (returns) of six companies, and the S&P 500 Index. Once you have opened your starter file:
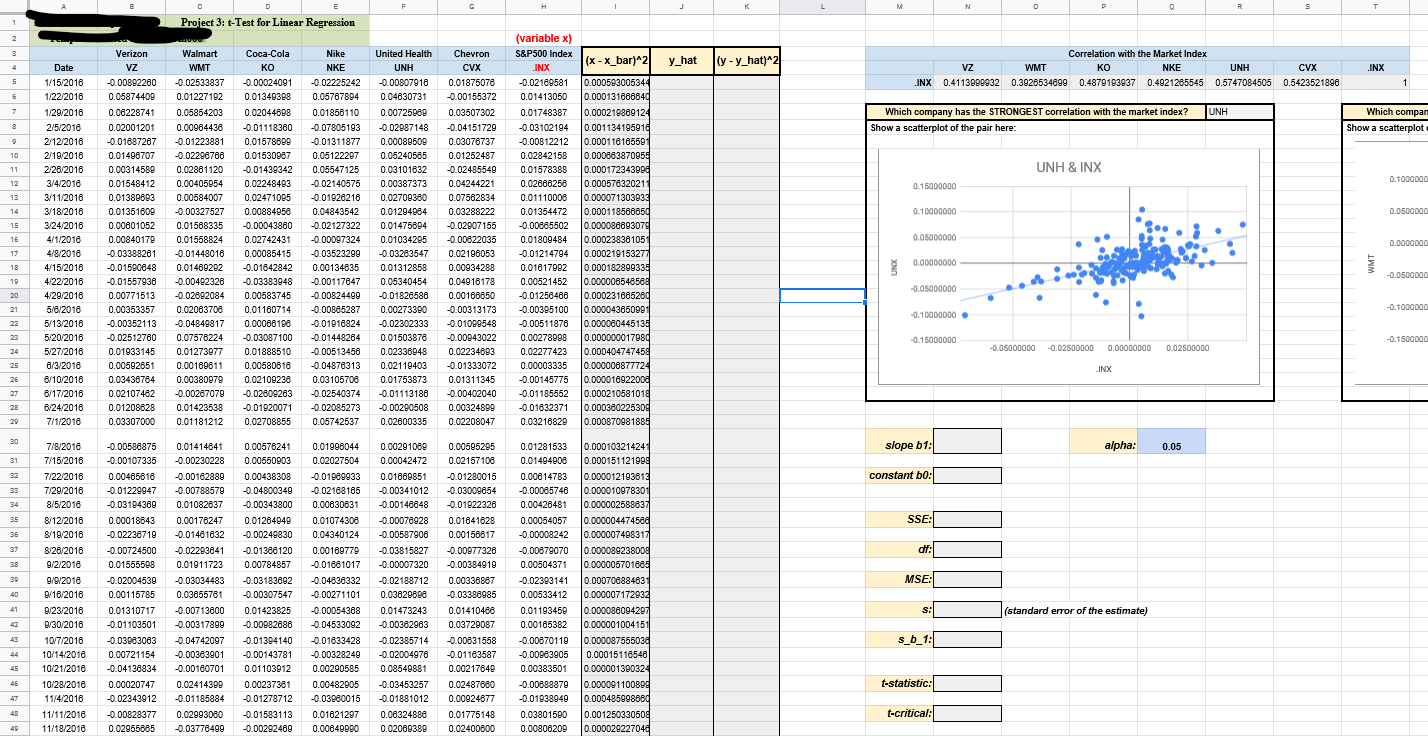
1. For each of the given six companies, calculate the correlation coefficient for the company with the S&P 500 Index.Use function =CORREL(range1, range2); fill in the resulting values in the corresponding shaded cells N5 through S5.In cell T5, calculate the correlation of the Index with itself.2. Based on the correlation coefficients, answer the questions:
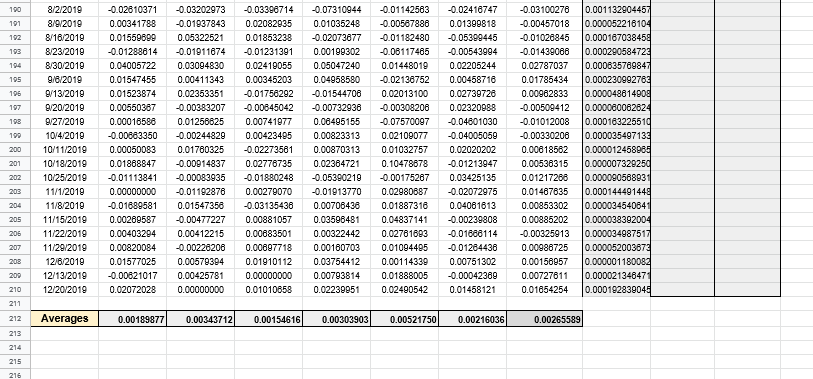
2. In cell H212 calculate the sample mean for .INX data; then fill in column I with values calculated based on the formula (x ? ??)^2; use the absolute cell reference!
3. In cells N30 and N32 calculate the coefficients for the estimated regression equation? ? = ?0 + ?1?: use =SLOPE to calculate slope b1 and =INTERCEPT to calculate the y-intercept b0.If you did everything correctly, these calculated values will match the numbers in the equation in the chart. (Note: the notation of the sort 1.234E-04 used in the chart is the so called scientific notation, it means 0.0001234)
4. Using the values in cells N30 and N32, calculate the predicted values of the dependent variable, i.e. ? ?.Fill in the corresponding shaded portion of column J.
5. Calculate the squares of residuals (?? ? ? ??)2 for each observation, and fill in the corresponding shaded areas of column K.
6. Calculate SSE (i.e., sum of squares of residuals) in the spreadsheet cell N35
7.. Calculate the df value in cell N37 as n - 2 (where n is the number of observations; to get it, use =COUNT).Calculate Mean Square Error (??? = ??? ?? ) in cell N39. Calculate the standard error of the estimate? = ???? in cell N41
I already calculated correlation coefficient and I also calculated averages for each company and S&P500 Index. I also did (x-x_bar)^2
I really want to know how to calculate the rest. I am very confused with so much data.
Project 3: t-Test for Linear Regression (variable x) Correlation with the Market Index Verizon Walmart Nike United Health Chevron x - x_bar)*2 y_hat (y - y_hat)^2 WMT NKE UNH CVX INX Date NKE IN> -0.00892260 -0.00807918 0.01875076 1/22/2016 0.05874409 0.01227192 0.01349308 0.05767804 0.01413050 0.000131686640 Which company has the STRONGEST correlation with the market index? Which compa 1/28/2016 0.08228741 0.05854203 0.02044608 0.01856110 0.03507302 0.01748387 0.000219889124 Show a scatterplot of the pair here Show a scatterplot 0.02001201 0.00964438 -0.01118360 -0.02087148 -0.04151729 -0.03102194 0.001134195916 2/12/2016 0.01687267 0.01223881 0.01578609 0.00089508 0.00812212 2/18/2016 0.01496707 -0.02298786 0.01530887 0.05122287 0.05240585 0.01252487 0.02842158 0.000883870955 UNH & INX 2/26/2016 0.02861120 -0.01439342 0.05547125 0.03101632 0.01548412 0.04244221 3/1 1/2016 0.02471085 -0.01928216 0.07562834 0.01110008 0.10000080 3/18/2016 -0.00327527 0.04843542 0.01294984 0.03288222 0.000118586650 3/24/2016 0.00801052 -0.02127322 0.02807155 -0.00885502 0.000000 4/1/2016 0.00840179 0.02742431 -0.00097324 0.01809484 0.000238381051 4/8/2016 0.03388261 -0.01448016 0.00085415 -0.03523299 0.02196053 0.01214794 0.000219153277 0.00080600 -0.01590848 -0.01642842 0.01312858 UNX 4/22/2016 -0.01557936 -0.00492326 -0.03383948 0.00117847 0.05340454 0.04916178 0.00521452 -0.05000000 -0.02692084 -0.01826586 0.00166850 -0.01256466 -0.00885287 -0.10000000 . 5/8/2018 0.00353357 0.01160714 0.00273380 -0.00385100 0.000043650981 5/13/2016 0.00352113 -0.04849817 0.00068198 -0.01916824 -0.0230233 -0.01099548 -0.00511876 0.000080445135 -0.02512780 -0.03087100 -0.01448284 0.01503878 -0.00943022 -0.02500000 0.00080800 0.01933145 0.01273877 0.01888510 0.02336848 8/3/2016 0.00592651 0.00169811 0.00580618 0.021 19403 -0.01333072 0.00003335 .INX 6/10/2016 0.03436764 0.00380979 0.03105708 0.01753873 0.01311345 0.00145775 6/17/2016 -0.00287079 -0.02609263 -0.02540374 -0.01113186 0.000210581018 6/24/2016 0.01423538 -0.01820071 -0.02085273 -0.0028050 0.00324809 -0.01632371 7/1/2018 0.03307000 0.01181212 0.02708855 0.02800335 0.03216828 slope b1: alpha: 0.05 7/8/2016 -0.00586875 0.01996044 0.00291089 0.00595285 0.01281533 7/15/2016 -0.00107335 -0.00230228 0.02027504 0.00042472 0.02157108 0.01494906 0.000151121908 -0.01989933 0.01869851 -0.01280015 0.00814783 0.000012193613 constant bo: 7/22/2016 -0.00182389 0.00438308 7/28/2016 -0.01229947 -0.00788579 -0.02168165 -0.00341012 0.000010978301 8/5/2018 -0.03194389 0.01082837 -0.01822326 0.00018643 0.01264849 -0.00078928 8/19/2016 -0.02238719 -0.01481832 -0.00249830 0.04340124 -0.00587906 0.00156817 0.00008242 dif: -0.00724500 -0.02293841 -0.00879070 0.01911723 0.00784857 -0.00007320 -0.00384919 0.000005701685 9/9/2018 0.02004539 -0.03034483 -0.03183892 -0.04638332 -0.02188712 0.02393141 e/16/2016 0.001 15785 -0.00307547 0.03829608 0.00533412 0.000007172032 e/23/2016 0.00713800 0.00054368 0.01473243 0.01410468 0.01193450 standard error of the estimate) 10/7/2016 0.03863063 0.04742097 0.01394140 -0.01633428 0.02385714 0.00631558 0.00670119 0.00721154 -0.00383901 -0.00143781 -0.00328249 -0.02004976 0.000151 18548 10/21/2018 -0.00180701 0.01103812 0.00290585 0.08549881 0.00217649 0.00482805 -0.03453257 0.00888879 t-statistic: 10/28/2018 0.02414309 0.00237381 11/4/2016 -0.02343912 -0.01185884 -0.01278712 -0.03080015 -0.01881012 0.00924877 -0.01938949 11/11/2018 -0.00828377 0.02993080 -0.01583113 0.01821297 0.01775148 0.02069389\f